

In this tutorial, we explain how to calculate the correlation between two stocks in Excel. We demonstrate how to construct a correlation matrix as well.
Contents
Using Excel to calculate correlations between pairs of stocks
Here is a simple, step-by-step guide to obtaining the correlation coefficient between the returns of two stocks.
- Store the returns on each stock in separate columns next to each other.
- Click on an empty cell and type =correl to use Excel’s correlation function.
- For array1, choose the column where you have the returns on the first stock.
- For array2, choose the column where you have the returns on the second stock.
- Hit the enter button on your keyboard.
That is it! This should give you the realized correlation coefficient between the returns of the two stocks you have chosen over the sample period you have specified.
Note that this method works for any frequency of returns (i.e., daily, monthly, yearly, etc.).
Constructing a correlation matrix of stock returns
A correlation matrix for stock returns would look like the one in Figure 1 below. In this matrix, each cell represents the correlation coefficient for a pair of stocks.
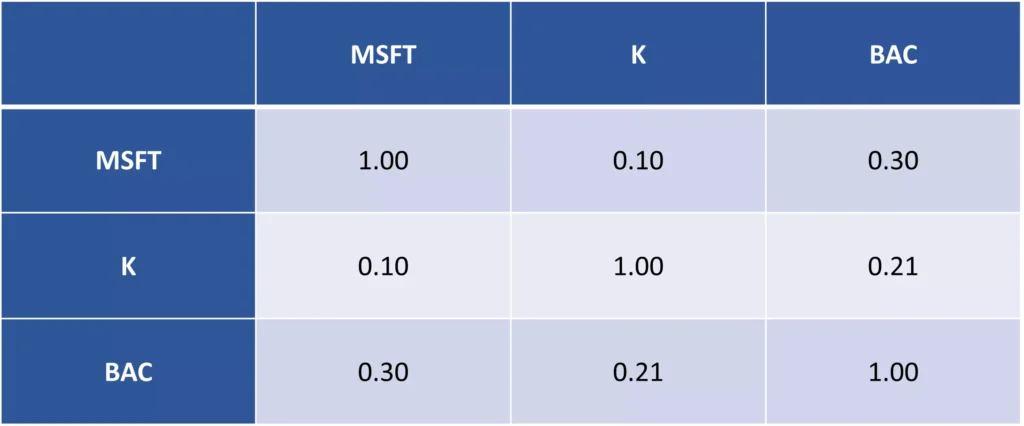
For example, if we focus on the first row of data, we see that the correlation between Microsoft (MSFT) and Kellogg (K) is 0.10, and the one between MSFT and Bank of America (BAC) is 0.30.
Note that the correlation coefficients on the diagonal cells must be equal to 1 as a stock would perfectly correlate with itself.
Finally, the correlation between stock A and stock B would be the same as the one between stock B and stock A (i.e., swapping the order doesn’t make a difference). For example, the correlation between MSFT and K and the one between K and MSFT are both equal to 0.10.
So, to construct the correlation matrix in Figure 1, it is sufficient to calculate three correlation coefficients only:
- MSFT and K
- MSFT and BAC
- K and BAC
Interpreting the correlation between two stocks
Correlation coefficients are extremely useful in terms of understanding how the returns of a stock are related to those of another.
Mathematically, the correlation coefficient always lies between the values of −1 and +1 where the former implies a perfect negative correlation and the latter a perfect positive correlation.
If the correlation coefficient between stock A and stock B is −1, these two stocks move in the opposite direction to one another, meaning that when one goes up, the other goes down.
Conversely, if the correlation coefficient is +1, then the two stocks move in the same direction, such that when one goes up the other also goes up, and when one goes down the other goes down too.
In general, if the correlation coefficient is negative, the two stocks tend to move in the opposite direction. If it is positive, they tend to move in the same direction. And, if the correlation coefficient is zero, the returns of the stocks are unrelated to each other (at least in a linear manner).
In reality, most stock pairs would have positive correlation coefficients (to different degrees), and part of this comovement is caused by the general market movements. Finally, it is worth noting that the correlation between two stocks can change over time.
Video tutorial: Correlation between two stocks
summary
We have explained how to use Excel’s correl function to obtain the correlation between two stocks and how to construct a correlation matrix.
It is important for investors to be aware that correlation coefficients between stock pairs are not static but evolve over time.
Further reading:
Pollet and Wilson (2010), “Average correlation and stock market returns” Journal of Financial Economics, Vol. 96(3), pp. 364-380.
what is next?
This lesson is part of our free tutorial on analyzing stock returns.
- Next lesson: We will show how to estimate a stock’s beta in Excel, using different methods.
- Previous lesson: We explained how to use Excel’s “Data Analysis” functionality to obtain descriptive statistics for stock returns.
We hope you have found this lesson useful. If you have got any feedback for us, you can use our contact form.