Welcome to the home of financial education.

Initial Return is the product of a collaboration between finance professionals, academics, and investors. We produce high-quality, educational content for investors, traders, and finance students.

Browse our free courses and tutorials

Watch our videos

Check out our latest content

  • Ambiguity aversion

    Ambiguity aversion

    Many of us might have heard about “risk aversion“, which is a general dislike for risk. But, what is “ambiguity aversion”? To address this question, we need to first distinguish between “risky events” and “ambiguous events”. Let’s do that through a practical example. Imagine a simple coin toss game where you win $1 if the…

    Continue reading

  • Psychology of trading

    Psychology of trading

    The psychology of trading encompasses the emotional states and moods that traders go through during their trading activities. Emotional trading can have an adverse impact on a trader’s performance, leading to mental issues as well as financial loss. Therefore, all traders should have at least a basic understanding of how emotions influence trading activity. We’ve…

    Continue reading

  • Limit order book

    Limit order book

    In a market setting, a limit order book for a particular security (e.g., a stock) is the collection of limit orders (both buy and sell) submitted by traders who are interested in trading that security. What does a limit order book look like? Figure 1 illustrates what a typical limit order book looks like. We…

    Continue reading

  • Capital allocation line

    Capital allocation line

    When a risk-free asset exists in an economy, investors can add that asset to their portfolios if they wish so. In the risk-return space, the combination of the risk-free asset and any risky asset is a straight line. This line is called the capital allocation line as it shows how an investor’s capital is allocated…

    Continue reading

  • How to calculate beta in Excel

    How to calculate beta in Excel

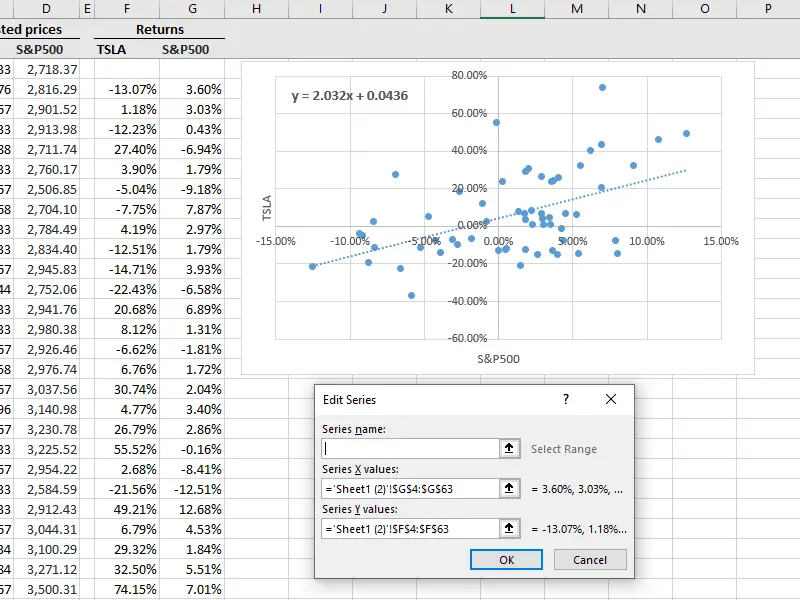
    In this tutorial, we’ll show you how to calculate beta in Excel. First, we explain the data you need before getting started. Then, we offer four different ways of computing betas in Excel (the first one is the fastest if you’re in a rush!). If you prefer a video tutorial, that is provided at the…

    Continue reading

  • Security market line

    Security market line

    The security market line depicts the linear relationship between expected return and systematic risk, which is measured by beta, according to the capital asset pricing model (CAPM). Specifically, the equation of the security market line is nothing but the CAPM formula: where E[Ri] is the expected return on asset i, E[Rm] is the expected return…

    Continue reading

  • Market portfolio

    Market portfolio

    We have so far learned how to calculate the risk and return of portfolios and how to trace an efficient frontier through mean-variance optimization. It is now time to introduce a special portfolio that will play a significant role when we discuss the CAPM: The market portfolio. What is the market portfolio? The market portfolio is the…

    Continue reading

  • CAPM calculator, equation, assumptions

    CAPM calculator, equation, assumptions

    The capital asset pricing model (or CAPM) is among the most widely-used asset pricing models by stock analysts and portfolio managers. Its popularity arises from its simplicity and elegance. Analysts can use it to forecast returns or to estimate the cost of equity. In this post, we offer a CAPM calculator and discuss the model…

    Continue reading

  • Minimum variance portfolio

    Minimum variance portfolio

    In a market with multiple risky assets, the minimum variance portfolio is a particular combination of those assets that yields the minimum volatility. To be more specific, consider the market depicted in Figure 1. Here, the blue curve represents the efficient frontier. That is, all portfolios that lie on it are efficient portfolios (e.g., D…

    Continue reading

  • Treynor ratio formula, calculator

    Treynor ratio formula, calculator

    Treynor ratio is a popular risk-adjusted performance measure. It was developed by the American economist Jack Treynor in the mid-1960s (you can find the reference for his seminal paper at the bottom of this page). It is a measure of how much “excess return” (i.e., return above the risk-free rate) a security (stock, bond, mutual fund,…

    Continue reading