
Category: investments
-

Critical Tips Before Buying an ETF: What You Need to Know
Investing in Exchange-Traded Funds (ETFs) offers a practical way to diversify your portfolio with a single purchase. This comprehensive guide will walk you through the essential steps to consider when selecting an ETF. What is an ETF? An Exchange-Traded Fund (ETF) is an investment vehicle traded on stock exchanges, like individual stocks. ETFs can hold…
-

Global portfolio management
Global portfolio management extends the territorial reach of typical investment strategies, venturing beyond domestic borders to embrace international securities and monetary vehicles. This comprehensive approach is driven primarily by a quest to tap into diversified sources of income and asset classes that show disparate market behaviors, often not correlated with home market movements. International diversification…
-
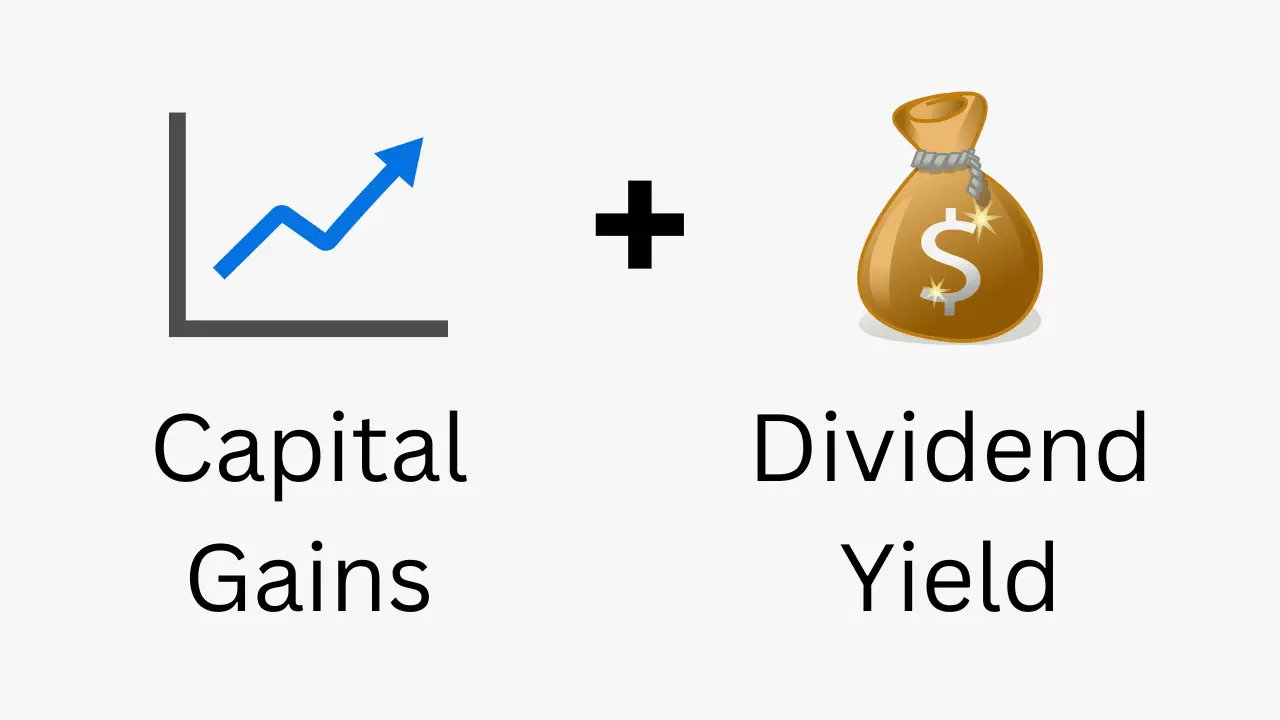
Total return formula and calculator
In the second lesson of our investments course, we’ll be learning about a stock’s total return and its two components: capital gains and dividend yield. Total return formula Imagine that you bought a stock a few months ago for $10 per share and the current share price is $12. Based on what we learned in…
-
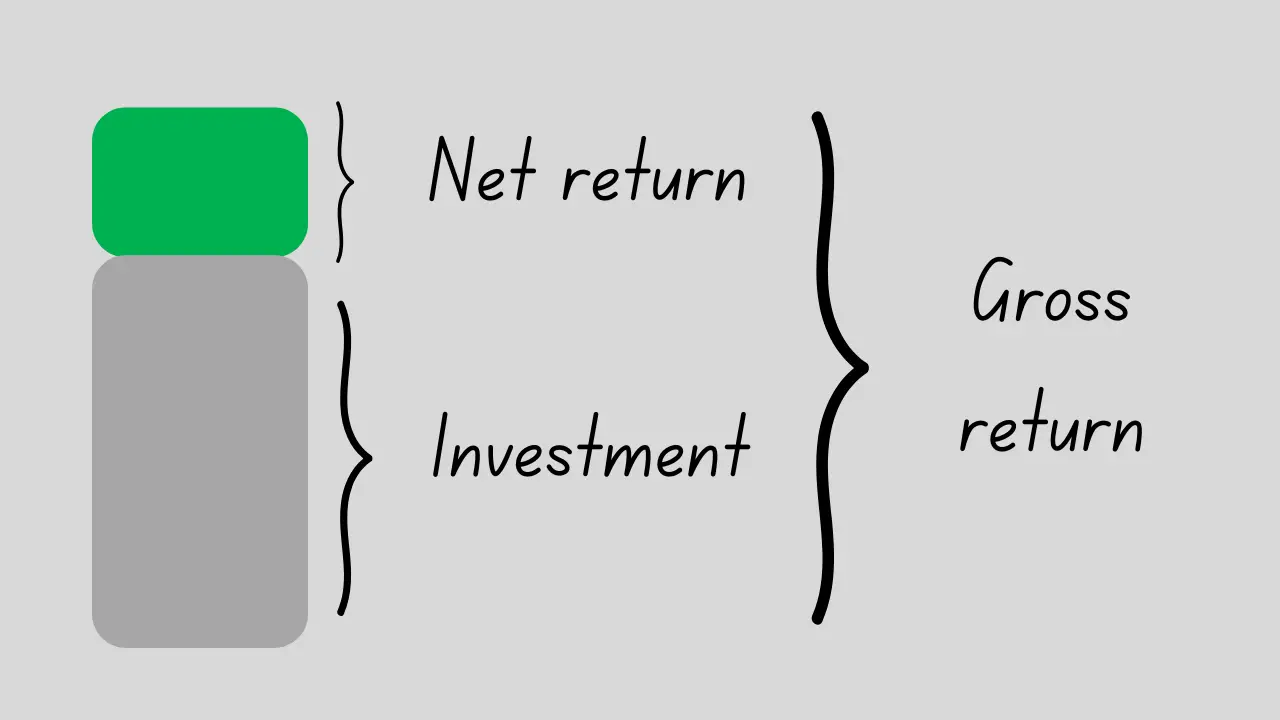
Gross return vs net return
We begin our investments course by introducing fundamental return calculations. It’s essential to grasp the difference between gross returns and net returns from the outset. We define these two fundamental concepts below with practical examples. You might find the video tutorial at the end useful as well. Gross return Let’s suppose you bought shares of…
-

Portfolio risk calculator and formula
We often say that risk and return are two sides of the same coin. So, when assessing the performance of a portfolio, we need to consider its risk as well as its return. In the previous lesson, we focused on portfolio return. Now, we turn our attention to portfolio risk. Portfolio risk calculator You can…
-
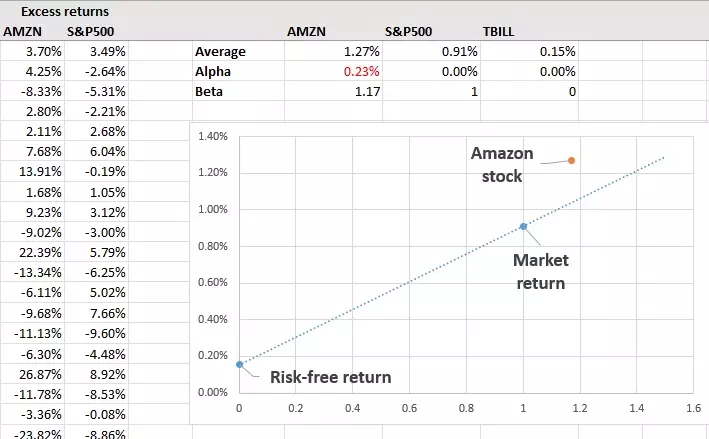
How to calculate Jensen’s alpha in Excel
The purpose of this tutorial is to teach you to calculate Jensen’s alpha in Excel. We’ll estimate the Jensen’s alpha on Amazon (AMZN) shares using the S&P500 as the market benchmark and the 13-week T-bill as the proxy of risk-free asset. Our analysis will be based on five years of monthly data (i.e., 60 observations…
-
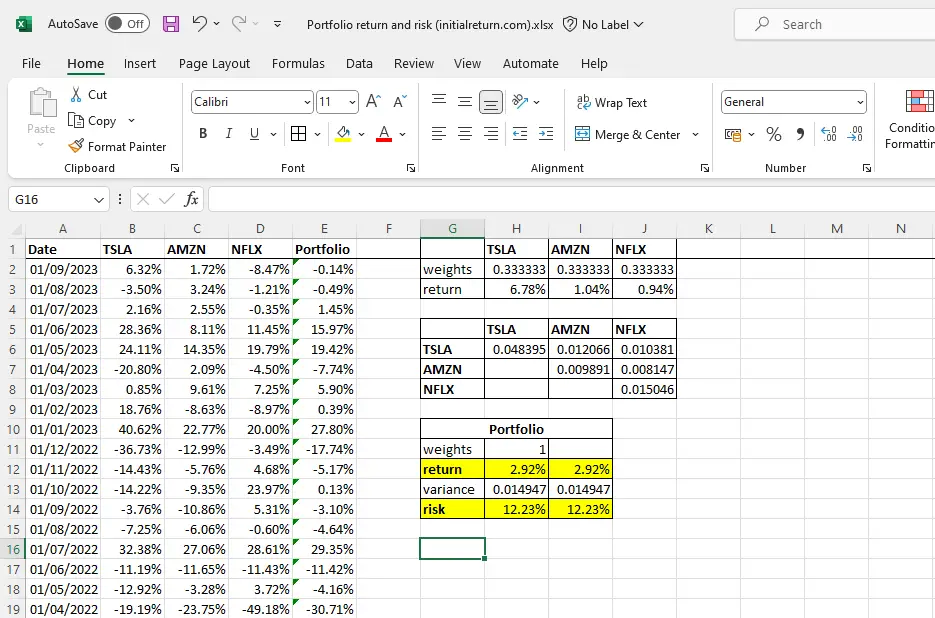
How to calculate portfolio risk and return in Excel
In this tutorial, we’ll teach you how to calculate portfolio risk and return in Excel. We’ll focus on an example where we construct a portfolio of the following three stocks: Tesla (TSLA), Amazon (AMZN), and Netflix (NFLX). If you’re unfamiliar with the formulas for portfolio return and portfolio risk, we’d recommend you check the following…
-
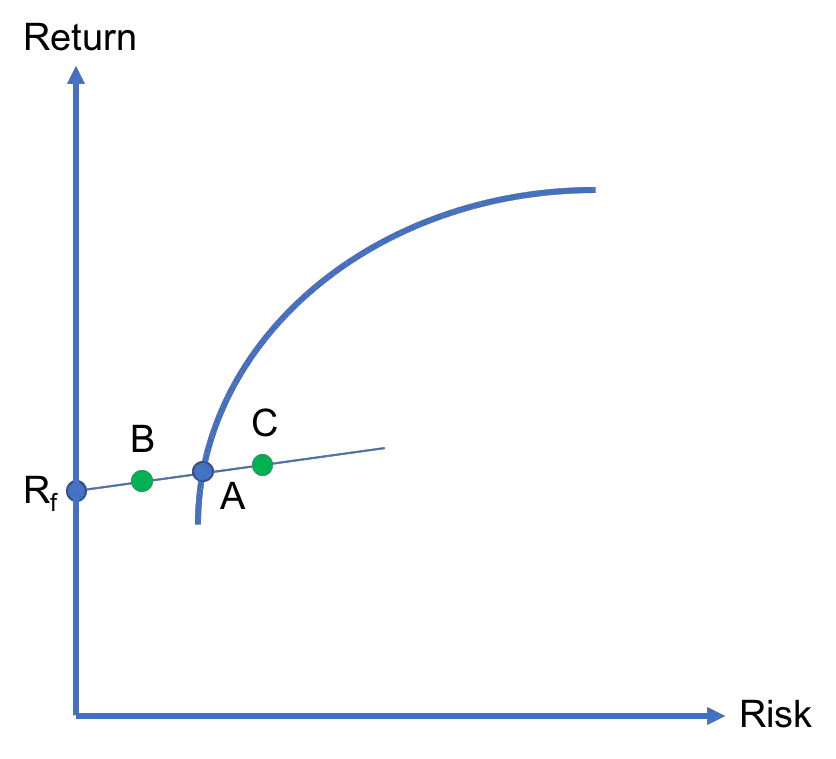
Capital allocation line
When a risk-free asset exists in an economy, investors can add that asset to their portfolios if they wish so. In the risk-return space, the combination of the risk-free asset and any risky asset is a straight line. This line is called the capital allocation line as it shows how an investor’s capital is allocated…
-
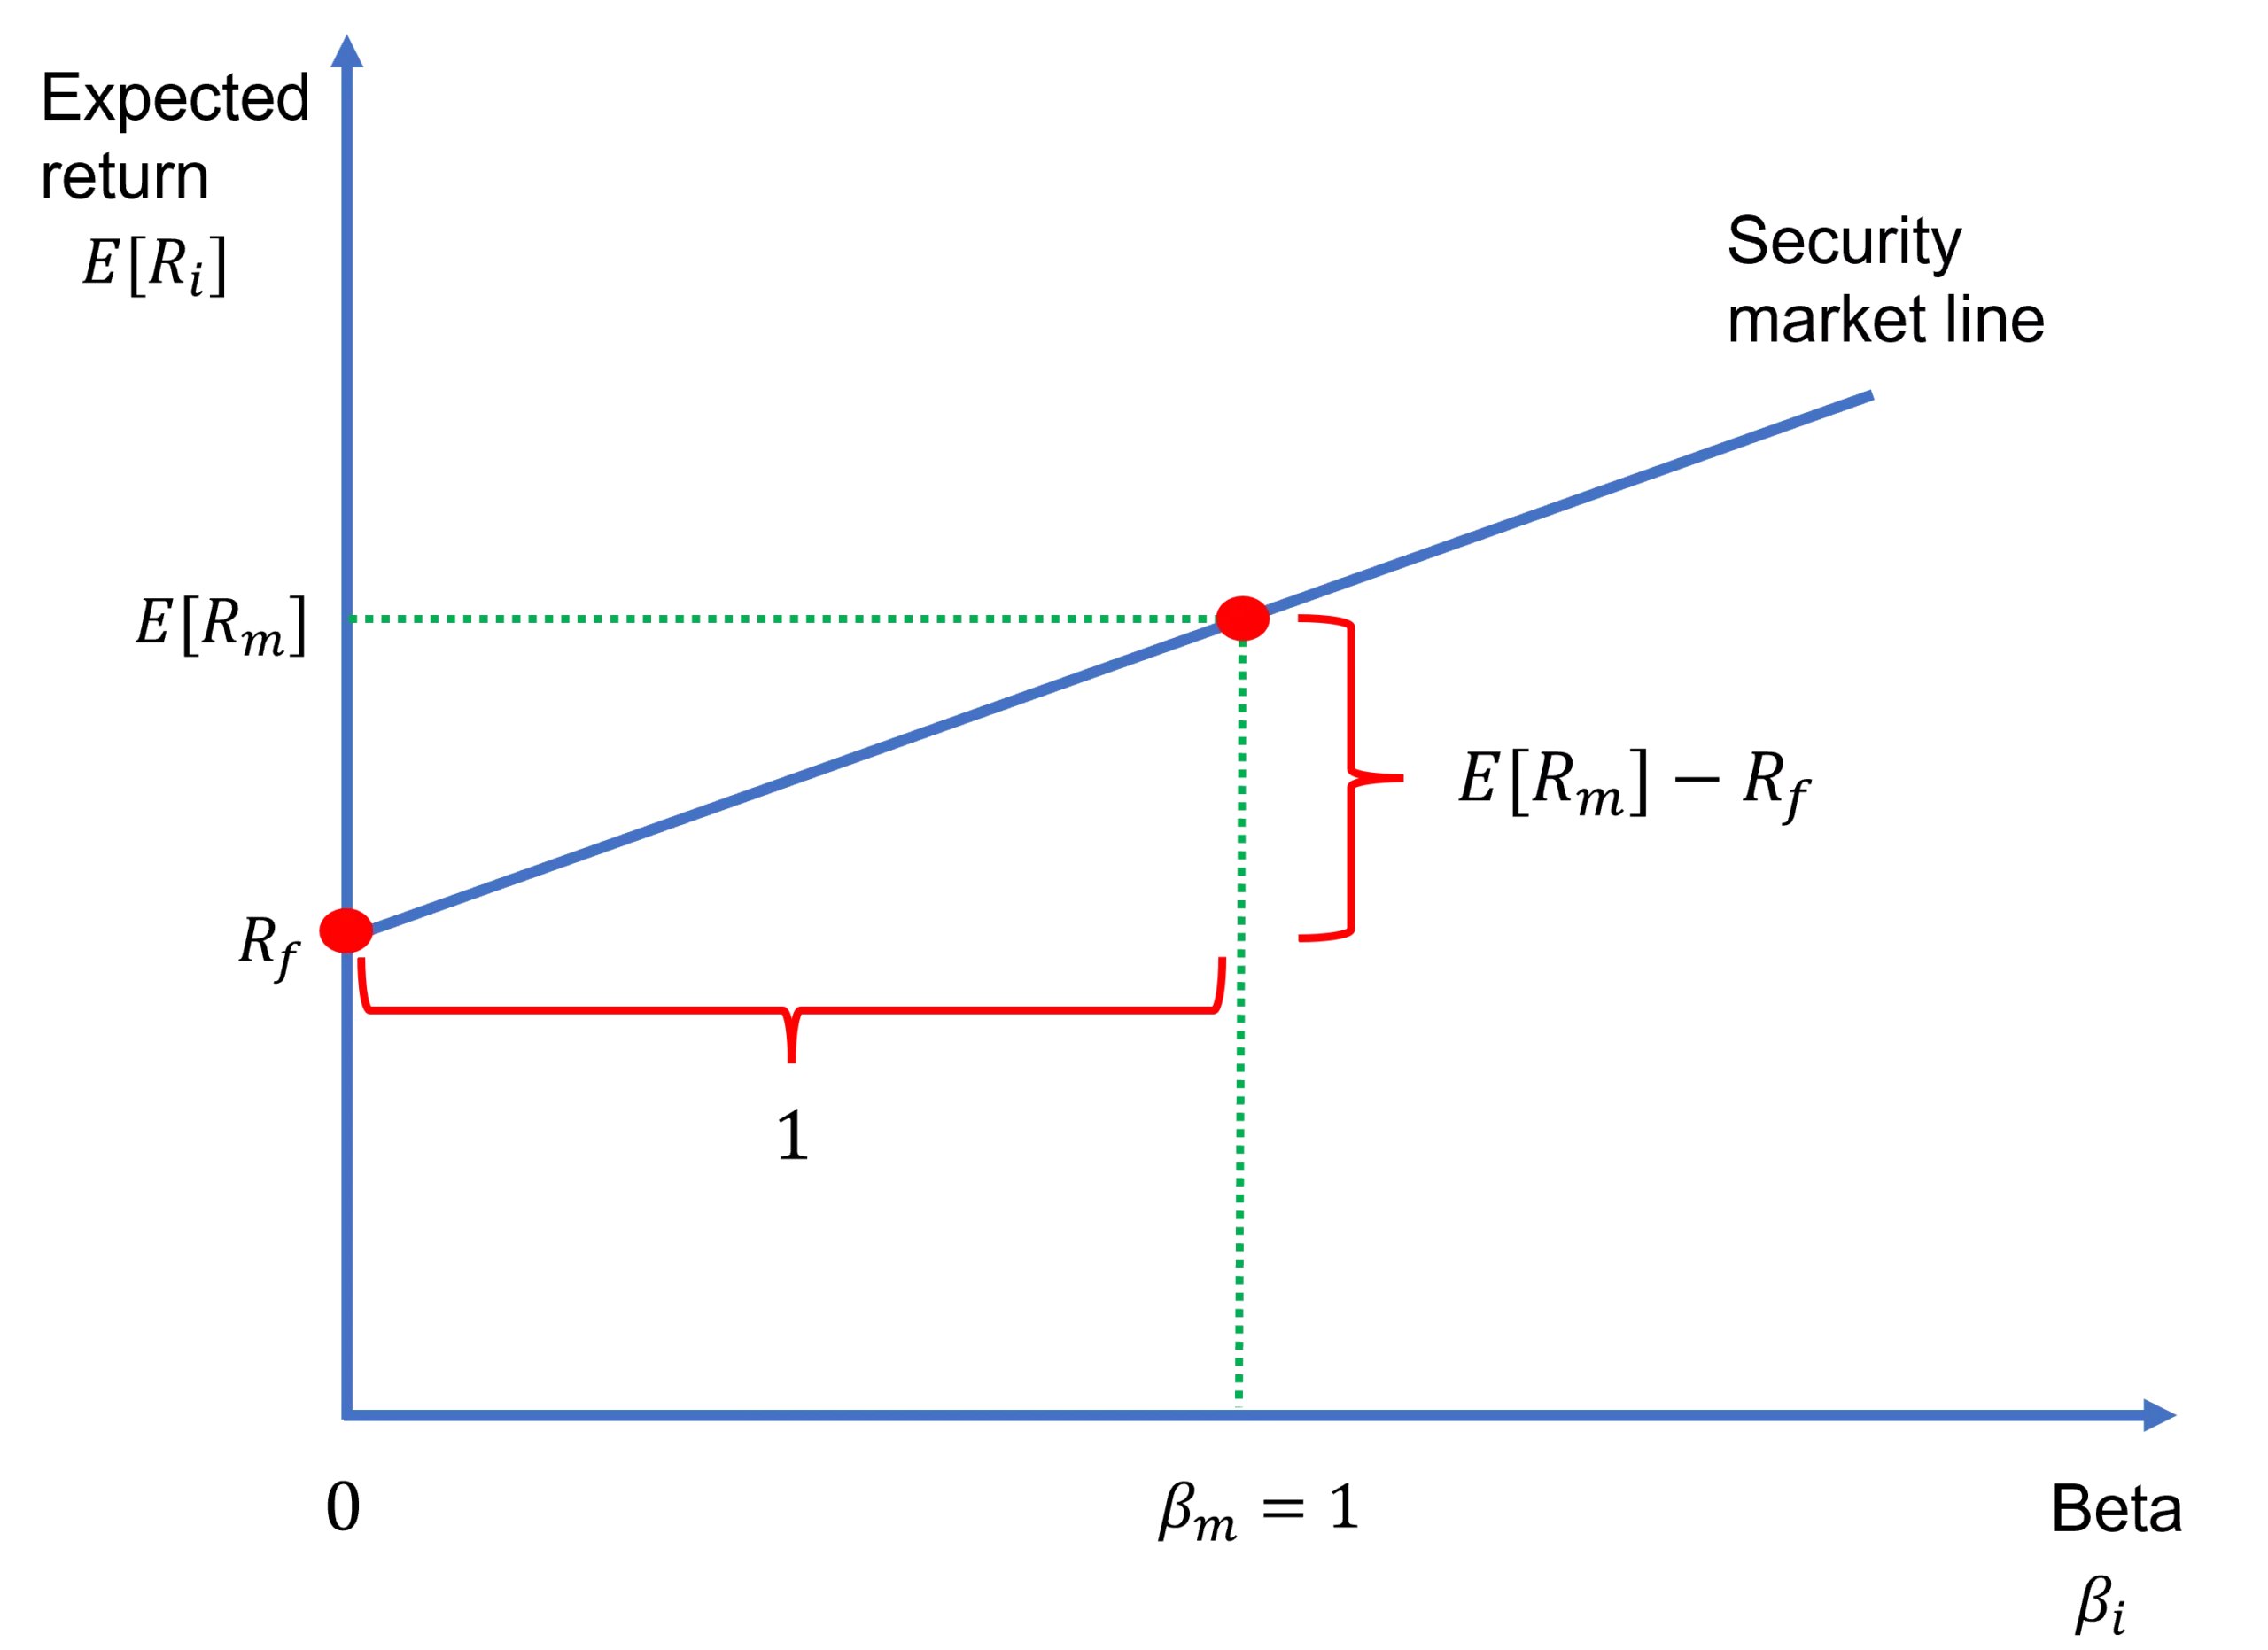
Security market line
The security market line (SML) depicts the linear relationship between expected return and systematic risk, which is measured by beta, according to the capital asset pricing model (CAPM). Specifically, the equation of the security market line is nothing but the CAPM formula: where E[Ri] is the expected return on asset i, E[Rm] is the expected…
-

Market portfolio
We have so far learned how to calculate the risk and return of portfolios and how to trace an efficient frontier through mean-variance optimization. It is now time to introduce a special portfolio that will play a significant role when we discuss the CAPM: The market portfolio. What is the market portfolio? The market portfolio is the…