
Category: stock returns
-
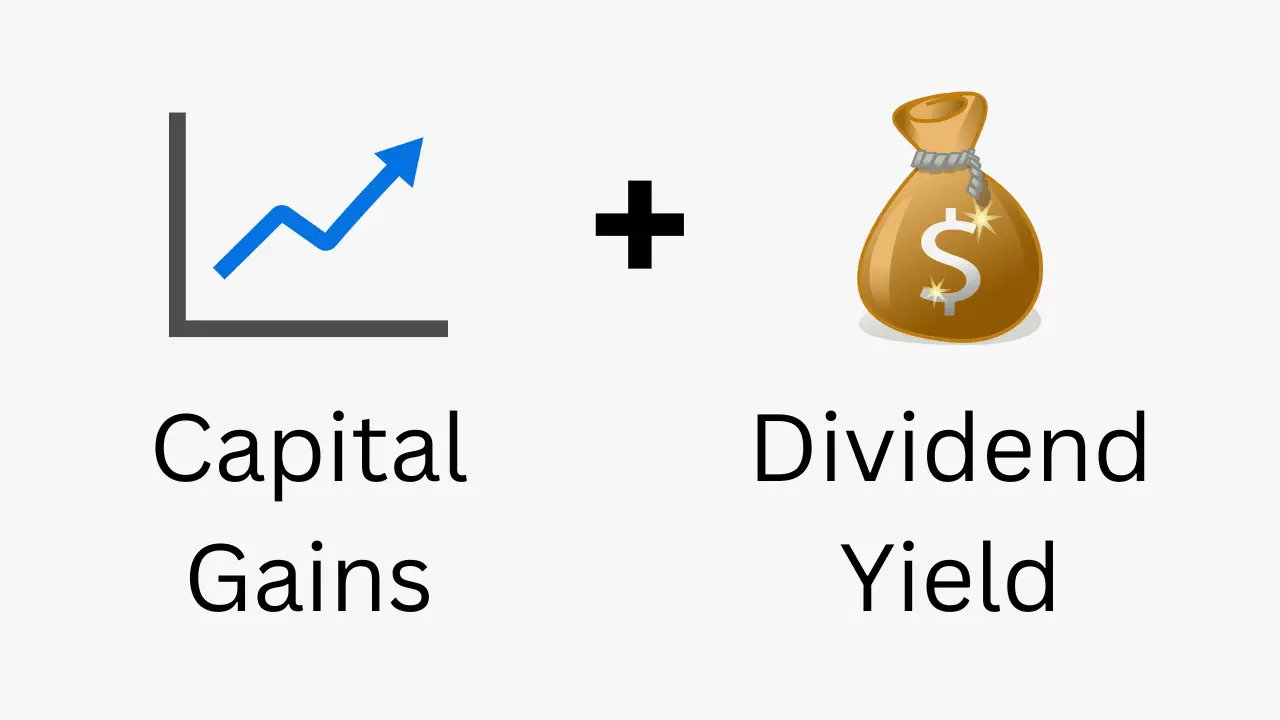
Total return formula and calculator
In the second lesson of our investments course, we’ll be learning about a stock’s total return and its two components: capital gains and dividend yield. Total return formula Imagine that you bought a stock a few months ago for $10 per share and the current share price is $12. Based on what we learned in…
-
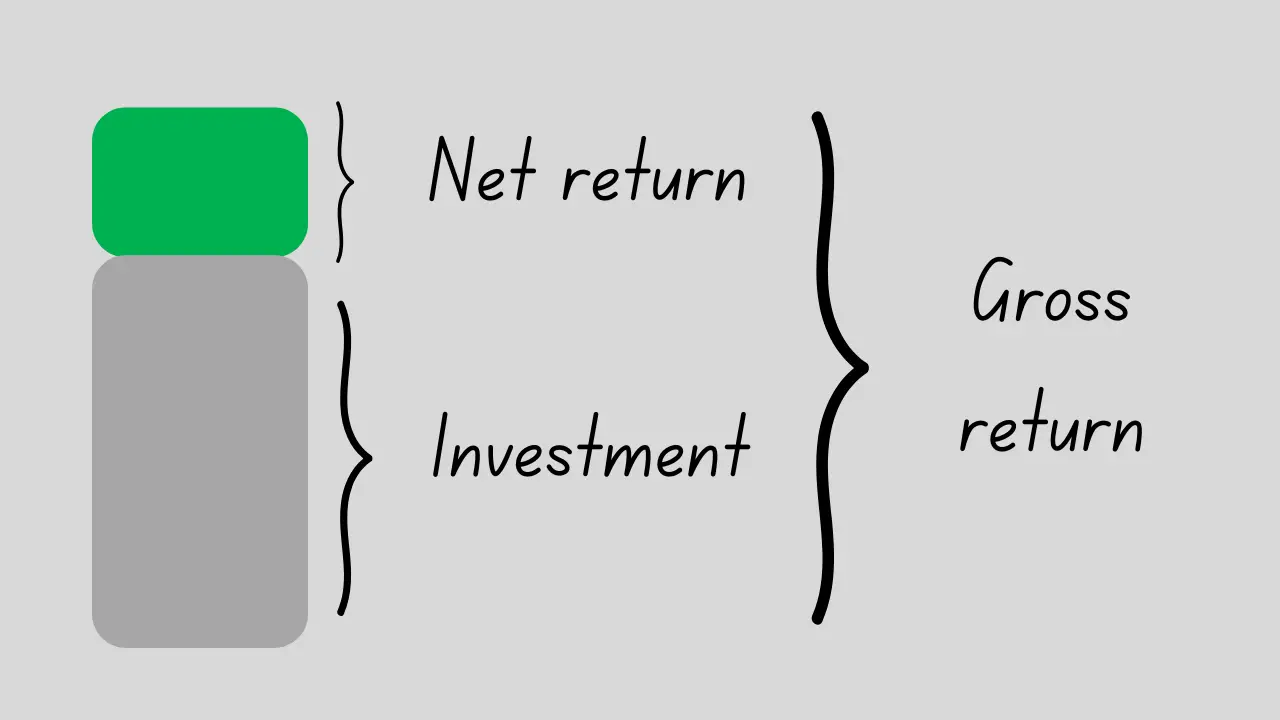
Gross return vs net return
We begin our investments course by introducing fundamental return calculations. It’s essential to grasp the difference between gross returns and net returns from the outset. We define these two fundamental concepts below with practical examples. You might find the video tutorial at the end useful as well. Gross return Let’s suppose you bought shares of…
-
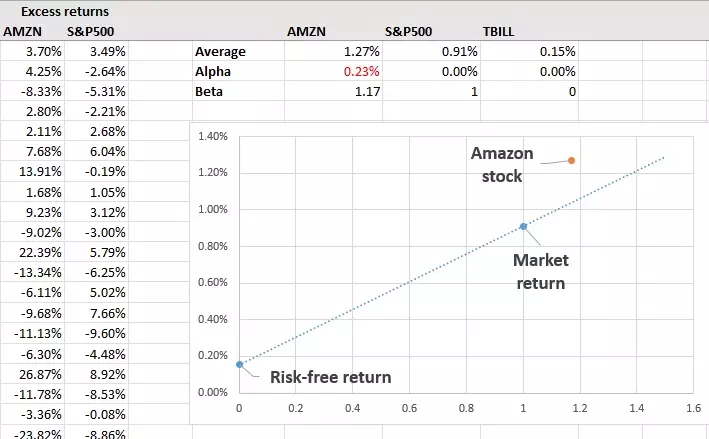
How to calculate Jensen’s alpha in Excel
The purpose of this tutorial is to teach you to calculate Jensen’s alpha in Excel. We’ll estimate the Jensen’s alpha on Amazon (AMZN) shares using the S&P500 as the market benchmark and the 13-week T-bill as the proxy of risk-free asset. Our analysis will be based on five years of monthly data (i.e., 60 observations…
-
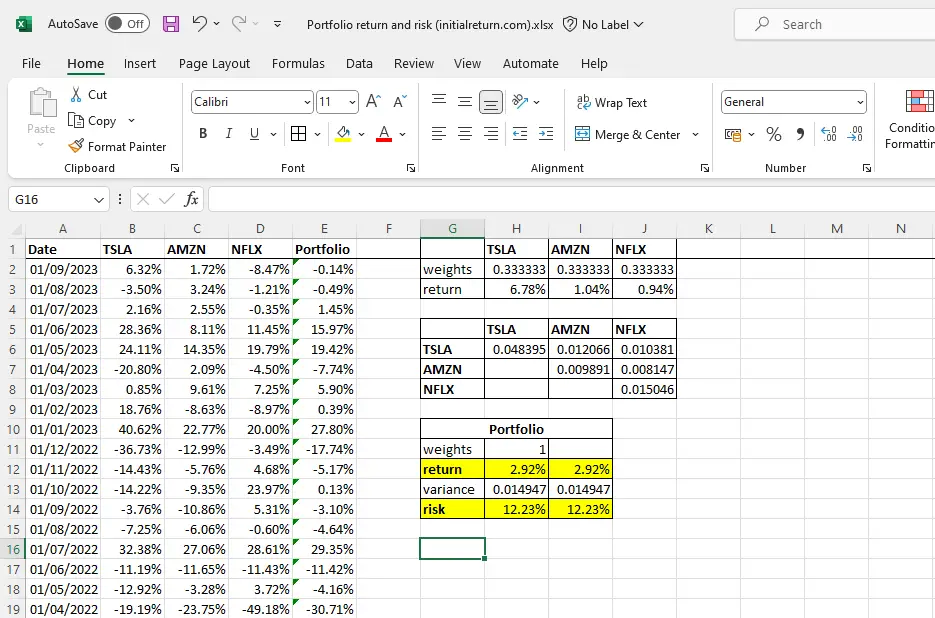
How to calculate portfolio risk and return in Excel
In this tutorial, we’ll teach you how to calculate portfolio risk and return in Excel. We’ll focus on an example where we construct a portfolio of the following three stocks: Tesla (TSLA), Amazon (AMZN), and Netflix (NFLX). If you’re unfamiliar with the formulas for portfolio return and portfolio risk, we’d recommend you check the following…
-
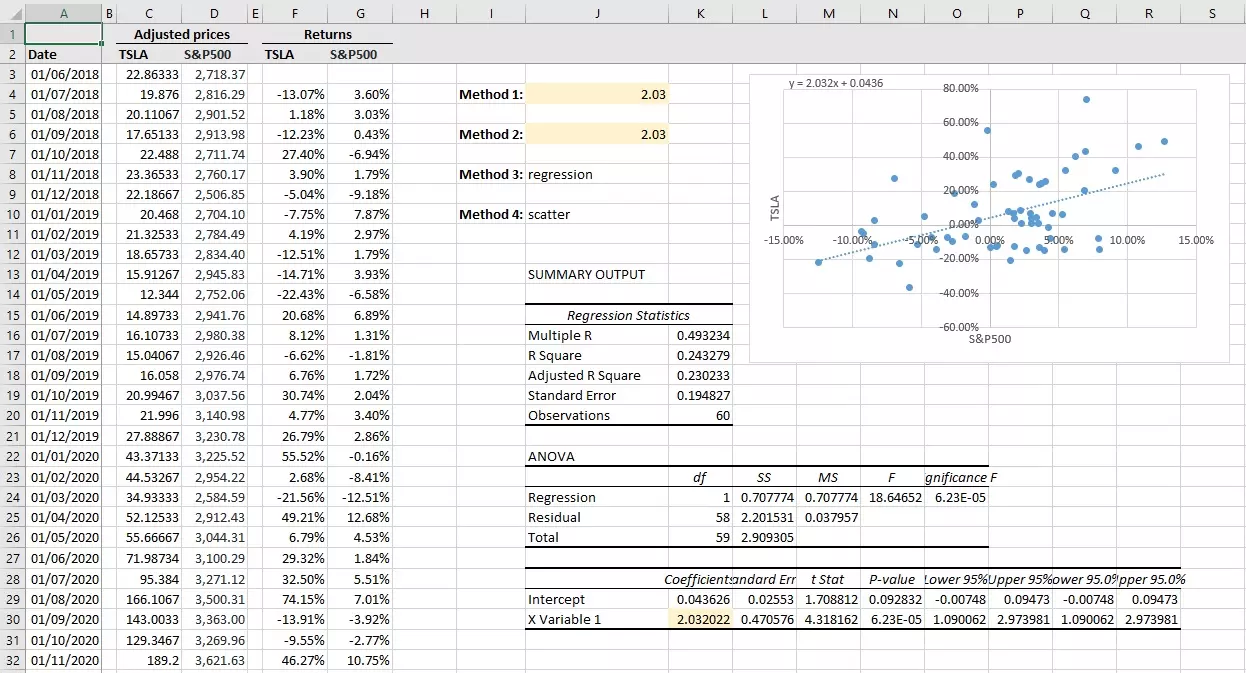
How to calculate beta in Excel
In this tutorial, we’ll show you how to calculate beta in Excel. First, we explain the data you need before getting started. Then, we offer four different ways of computing betas in Excel (the first one is the fastest if you’re in a rush!). If you prefer a video tutorial, that is provided at the…
-

Calculating the correlation between two stocks
In this tutorial, we explain how to calculate the correlation between two stocks in Excel. We demonstrate how to construct a correlation matrix as well. Contents Using Excel to calculate correlations between pairs of stocks Here is a simple, step-by-step guide to obtaining the correlation coefficient between the returns of two stocks. That is it!…
-
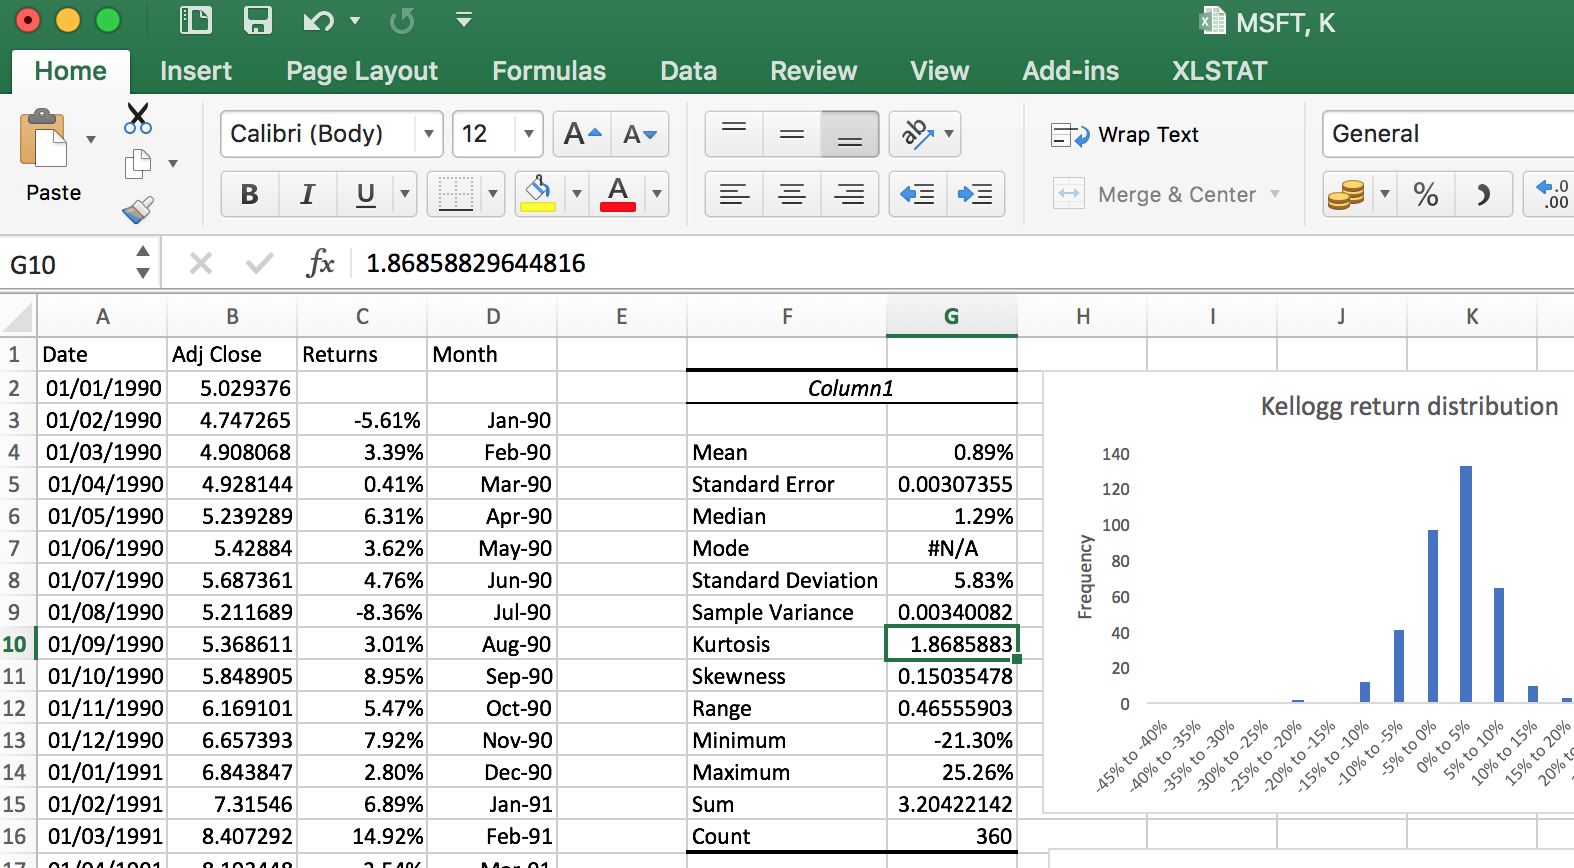
Descriptive statistics for stock returns
Descriptive statistics offer a simple way of understanding distributions of stock returns. They give us an idea about a distribution’s centrality, dispersion, symmetry, and other features. In this tutorial, we will show you how to generate descriptive statistics for stock returns using Excel’s data analysis tool. Using Excel to get descriptive statistics for stock returns…
-

Long position vs short position
It is easy for beginner traders to get lost when listening to conversations by seasoned traders. Trading involves lots of technical terms and specific jargon. For example, what does it mean to be “long” or “short” in a stock or option? This comes down to the following dichotomy: long position vs short position. In a…
-
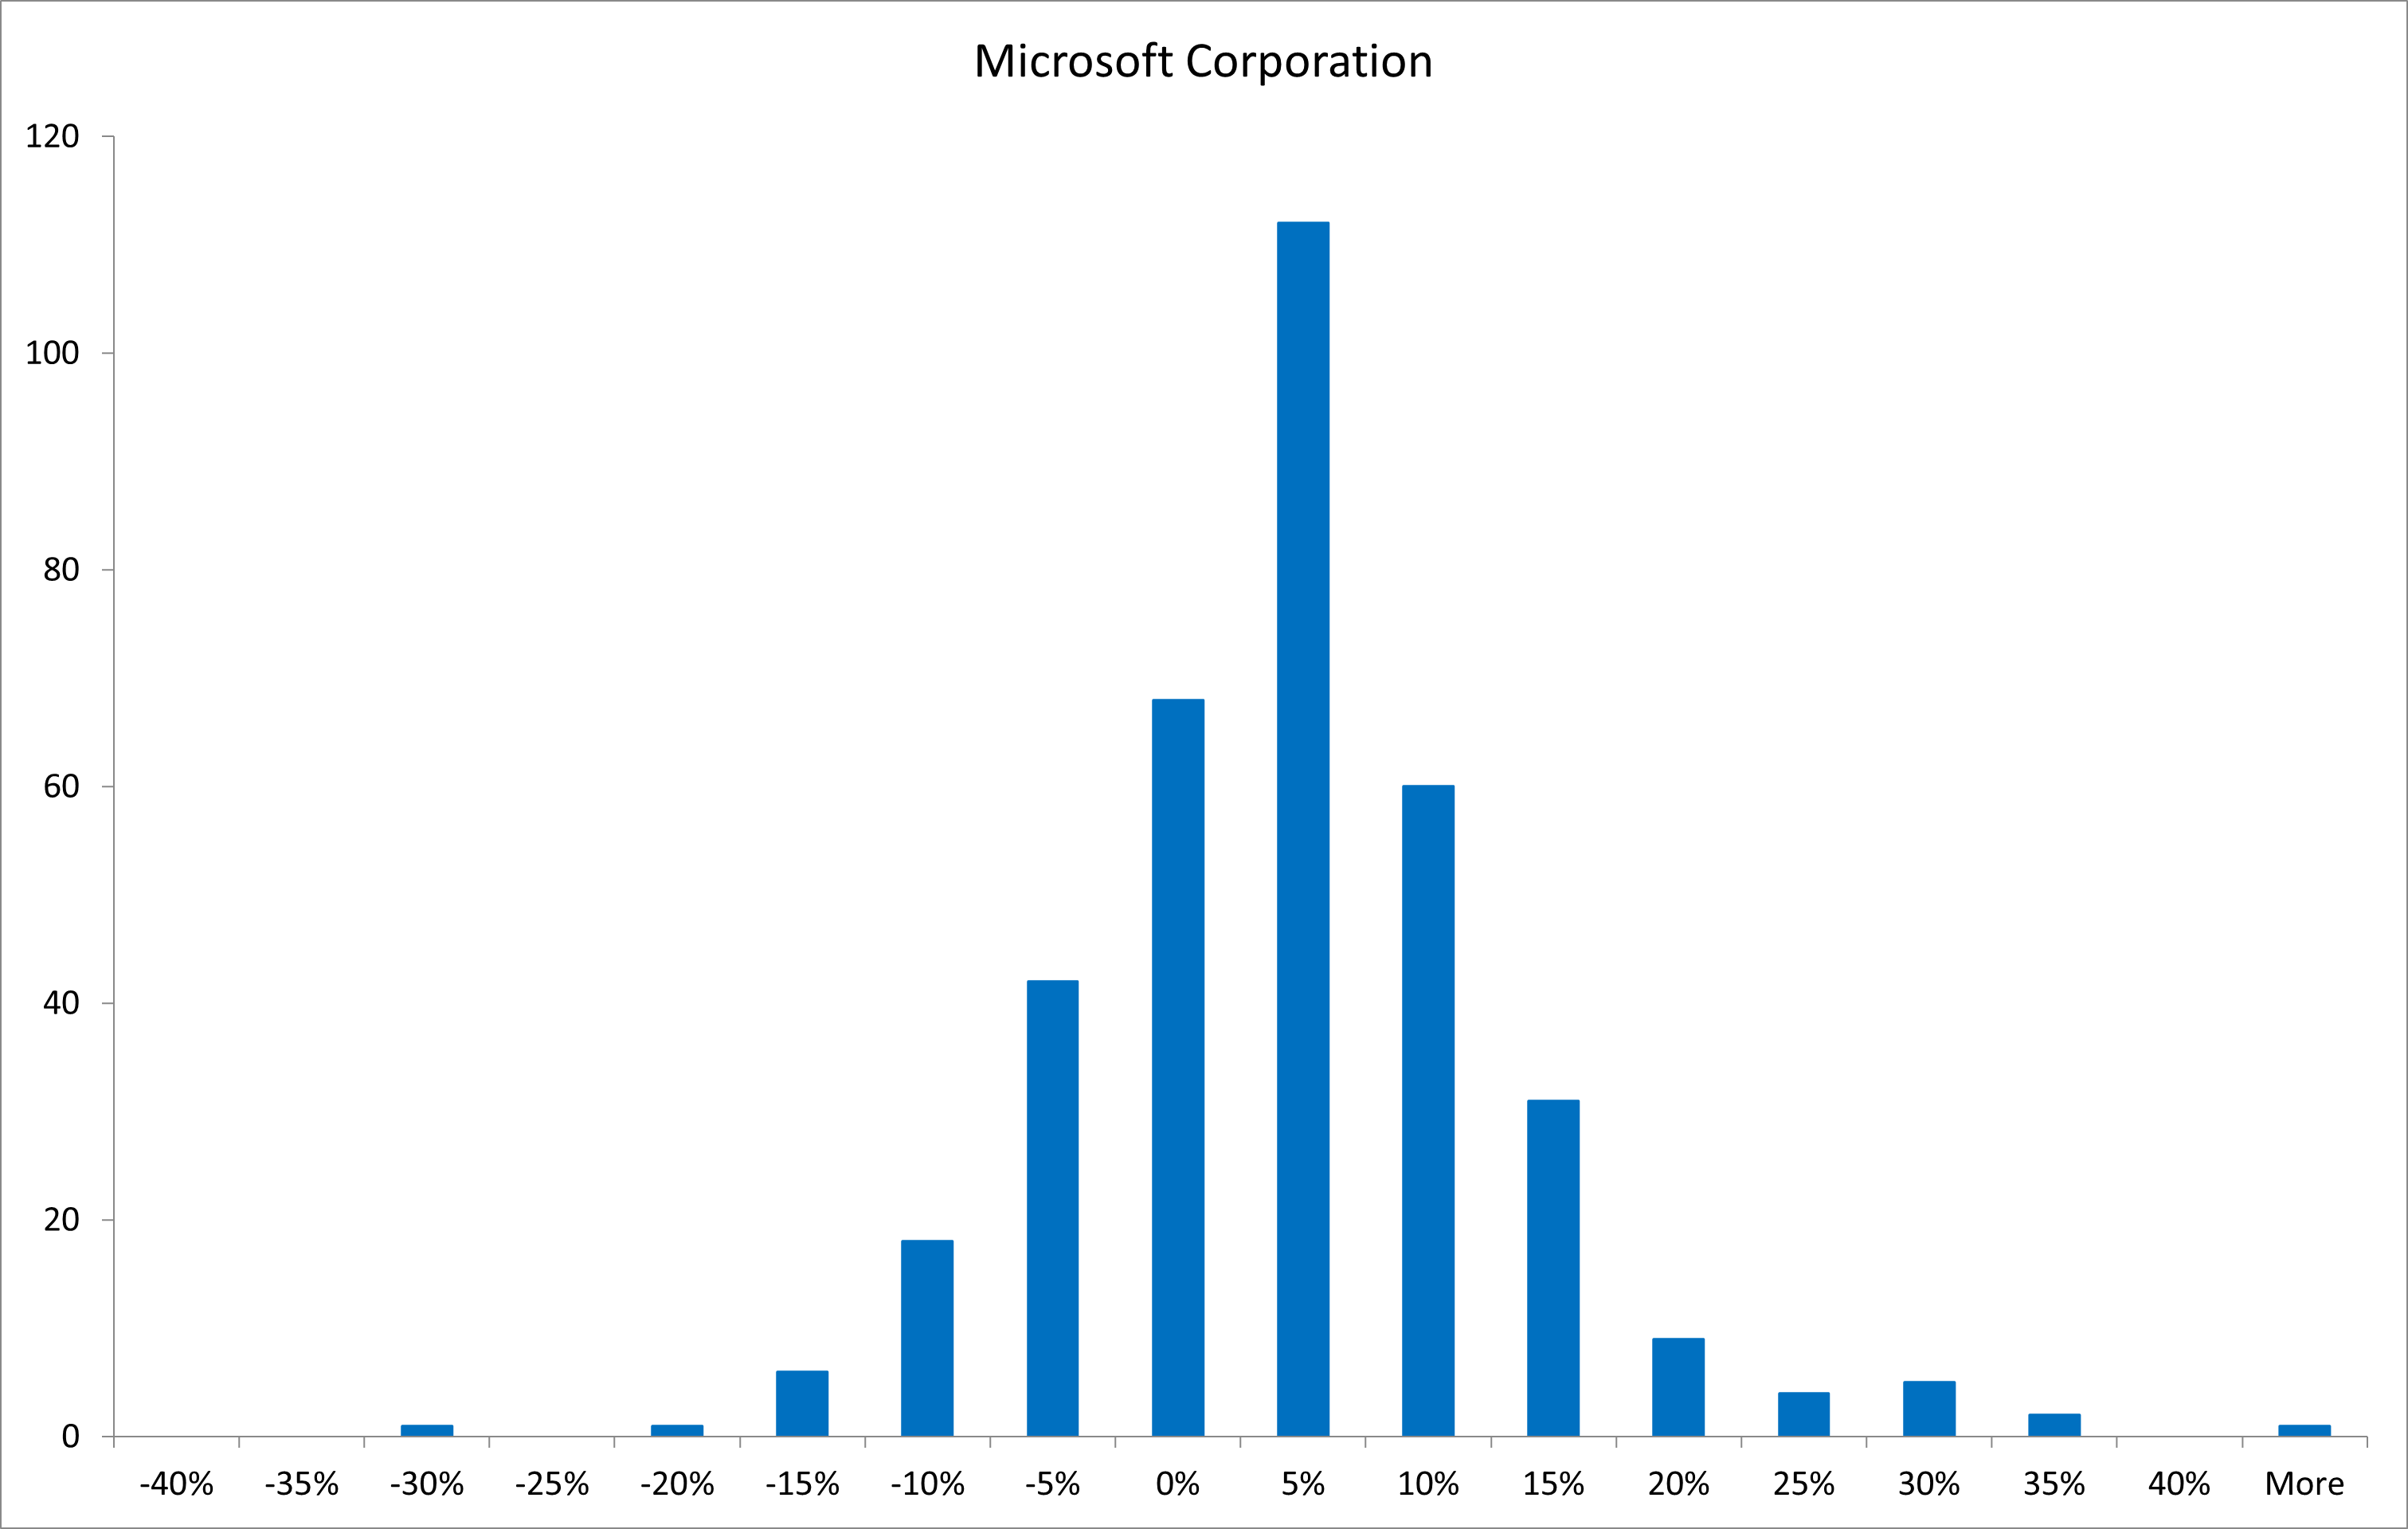
Creating a histogram of stock returns with Excel
An easy way to visualize the distribution of stock returns is to plot a histogram. In this tutorial, we will teach you how to create histograms of stock returns using Excel and explain how to interpret them. Using Excel’s “data analysis” tool to plot a histogram We’ll be working with the monthly returns of two…
-
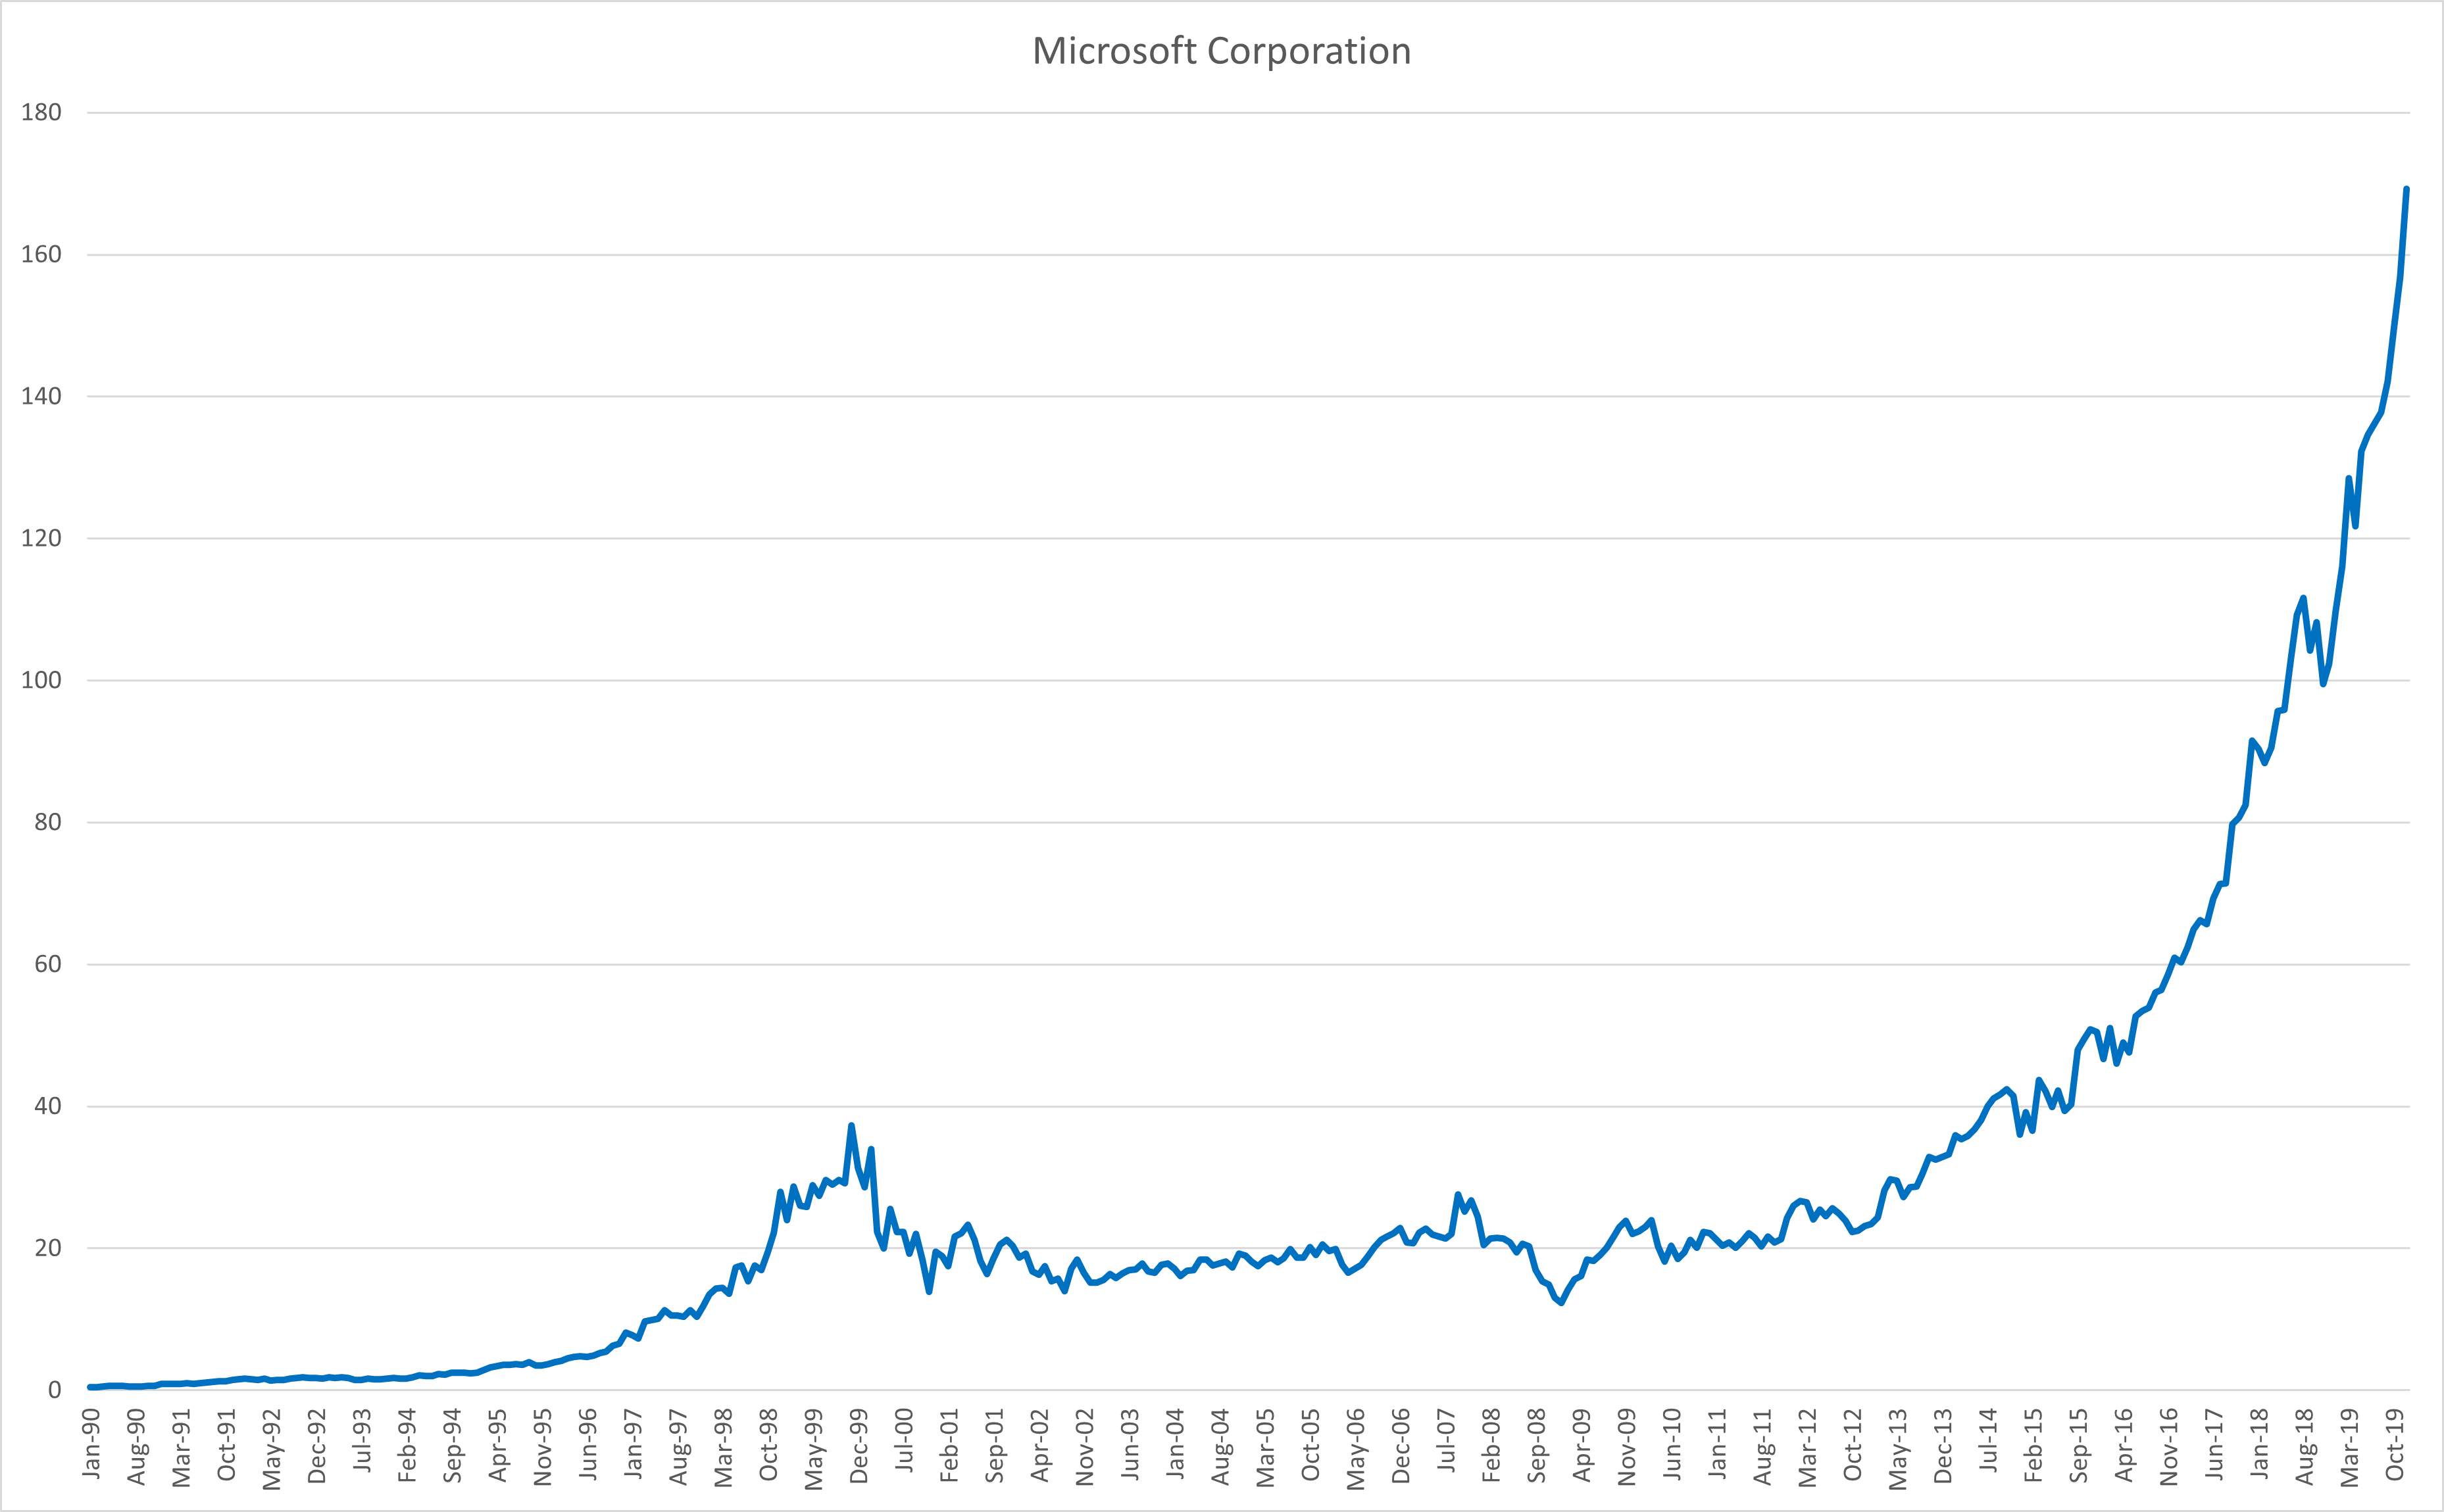
Plotting stock prices and returns
In this tutorial, we’ll teach you how to plot time series of stock prices and returns using Excel. We’ll explain how to interpret these plots as well. We’ve chosen to examine Microsoft (MSFT) and Kellogg (K) shares for the 30-year period between January 1, 1990 and January 1, 2020. The data is obtained from Yahoo! Finance…