
The security market line (SML) depicts the linear relationship between expected return and systematic risk, which is measured by beta, according to the capital asset pricing model (CAPM). Specifically, the equation of the security market line is nothing but the CAPM formula:

where E[Ri] is the expected return on asset i, E[Rm] is the expected return on the market portfolio, Rf is the risk-free rate of return, and βi is the beta of asset i.
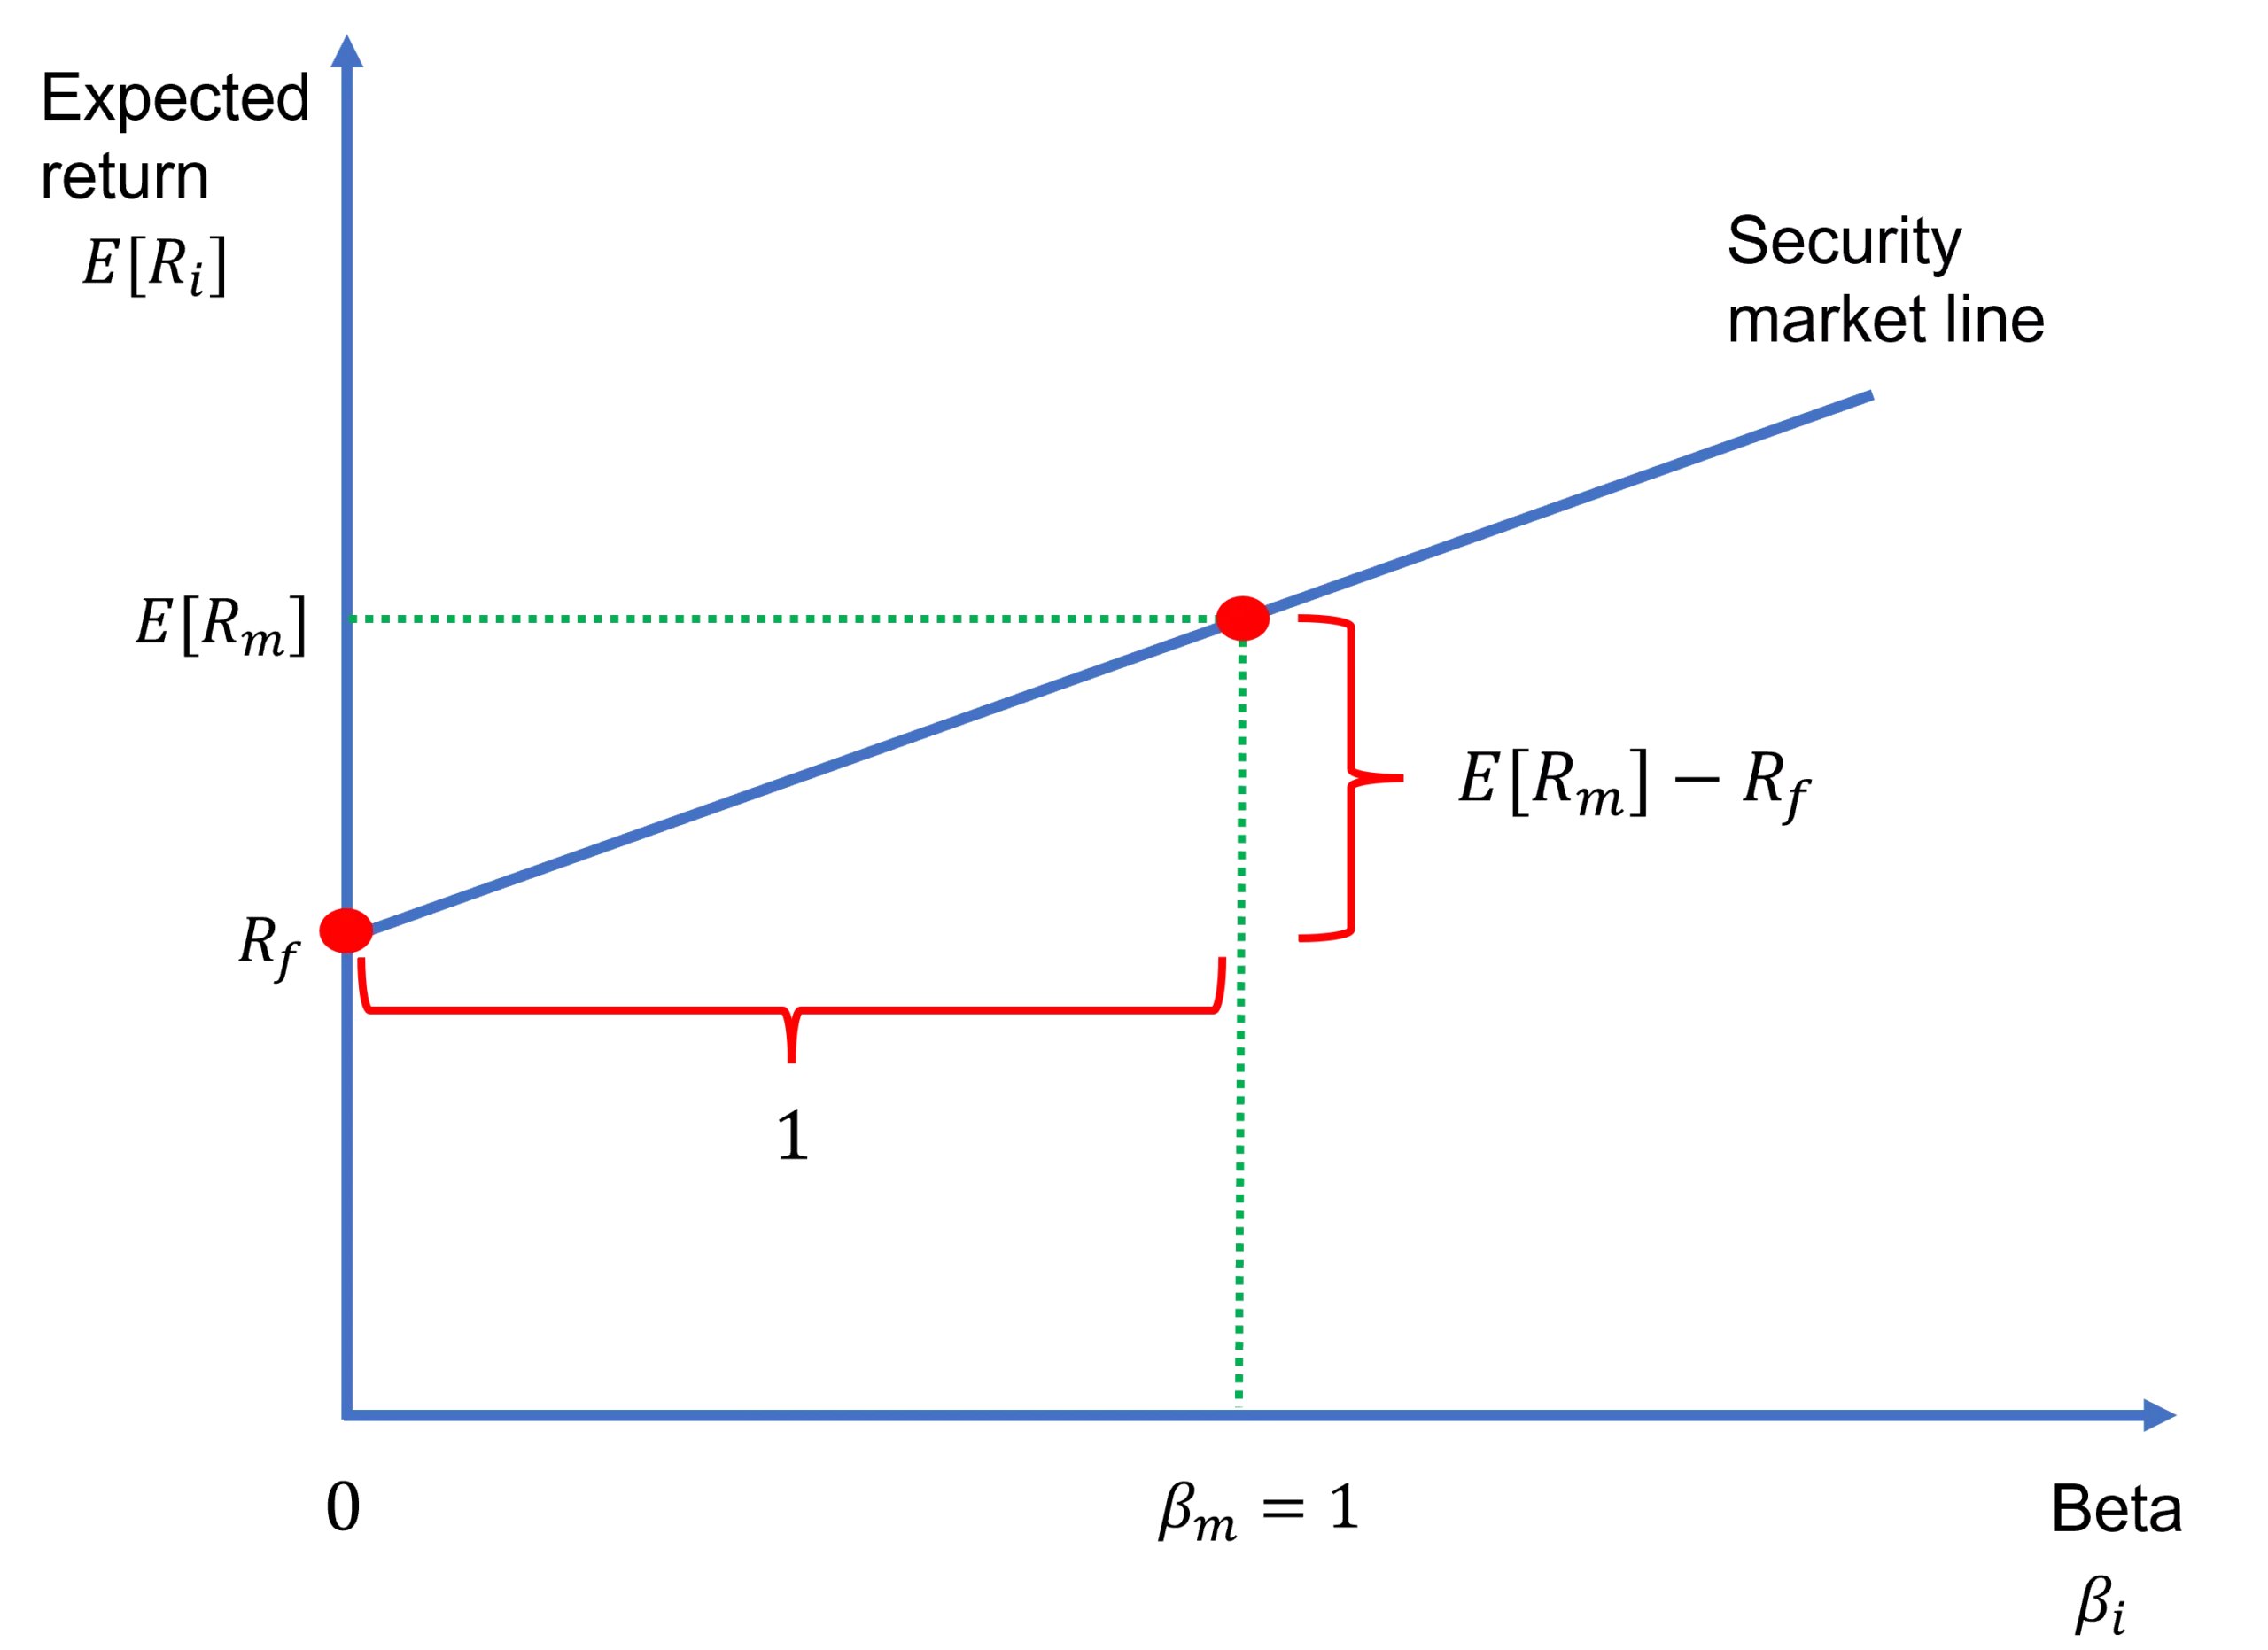
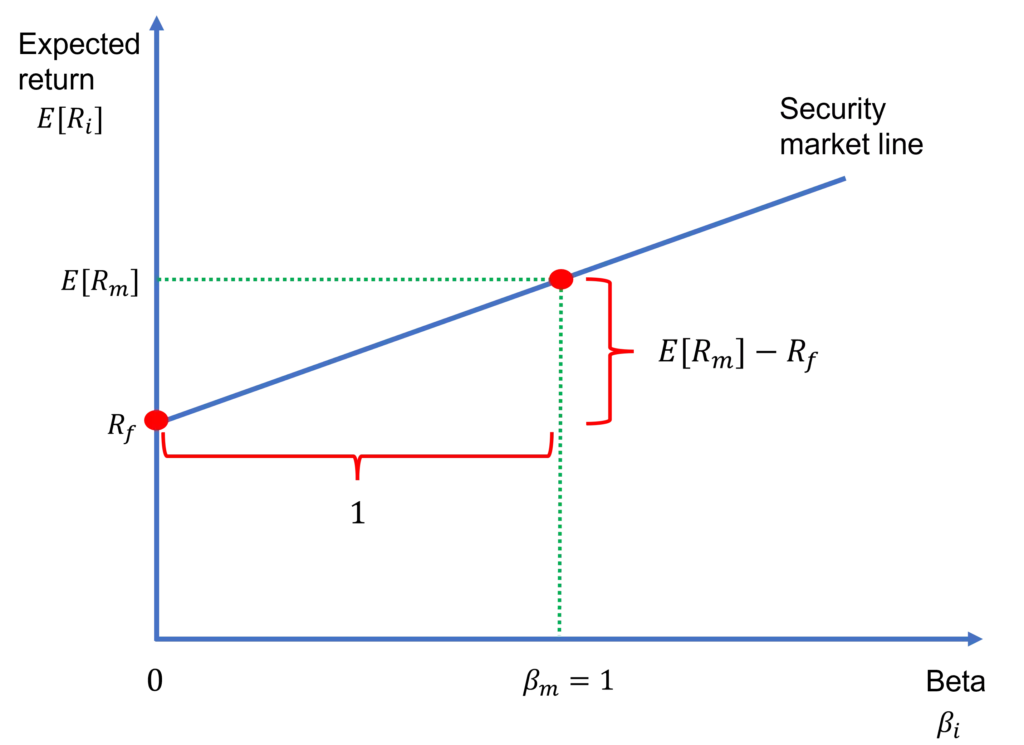
The SML is shown in Figure 1. Note that the general equation of a straight line is y = mx + c, where m is the slope of the line and c is the intercept. With that in mind, for the SML, E[Ri] and βi are the y and x variables, respectively. And, the slope m and the intercept c are E[Rm] − Rf and Rf, respectively. E[Rm] − Rf is referred to as the market risk premium as it is the excess return on the market risk portfolio.
Contents
Capital market line vs. security market line
Modern portfolio theory champions the idea that individual investors make optimal decisions in terms of the risk-return tradeoff when forming their portfolios of risky assets. In this context, risk is represented by return volatility σi and return by expected return E[Ri]. This results in an efficient frontier, which is the concave curve on the left-hand side in Figure 2 below. Moreover, if there is a risk-free asset in the market, we can combine that with the efficient frontier. This results in the optimal risky portfolio such that the line that connects the risk-free asset and the optimal risky portfolio is tangent to the efficient frontier.
CAPM argues that if all investors invest in the optimal risky portfolio, under additional assumptions, that portfolio becomes the market portfolio. And, the line where the market portfolio is tangent to the efficient frontier is the capital market line (CML):
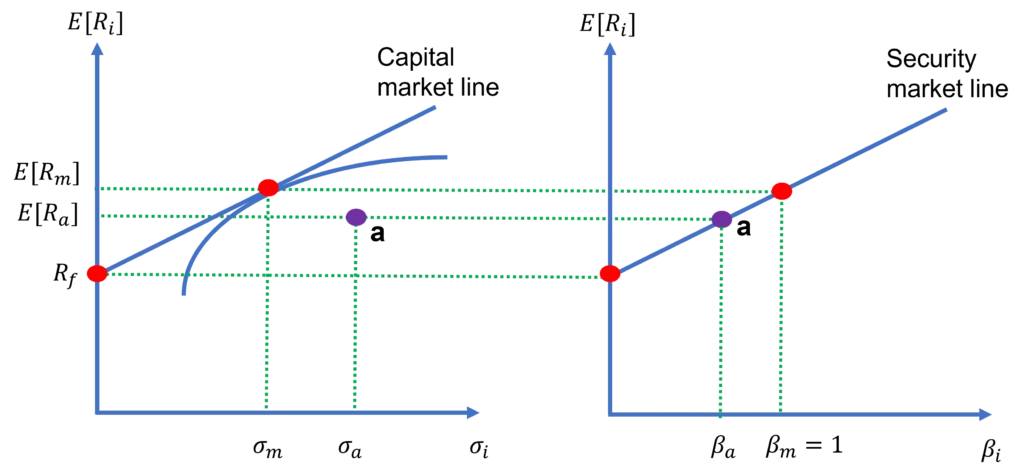
Both the capital market line and the security market line describe the relation between return and risk, but the difference is that the former relies on σi , which captures total risk, whereas the latter focuses on βi, which represents systematic risk. Furthermore, while the market portfolio lies on the CML, individual securities (e.g., stocks) lie below that. In contrast, both the market portfolio and the individual securities are expected to lie on the SML.
This is illustrated in Figure 2. Notice that the market portfolio m lies on both the CML and the SML, whereas an individual stock a is located below the CML but on the SML. The reason why is explained in the next section below.
Exploiting arbitrage opportunities
The premise of CAPM is that individuals hold well-diversified portfolios, and in such portfolios what matters is the systematic risk captured by beta as firm-specific risk is diversified away. This means that expected returns on risky assets should depend on their betas βi rather than their total risk σi. And, all risky assets should line up on the security market line as it represents the linear relationship between expected return and systematic risk.
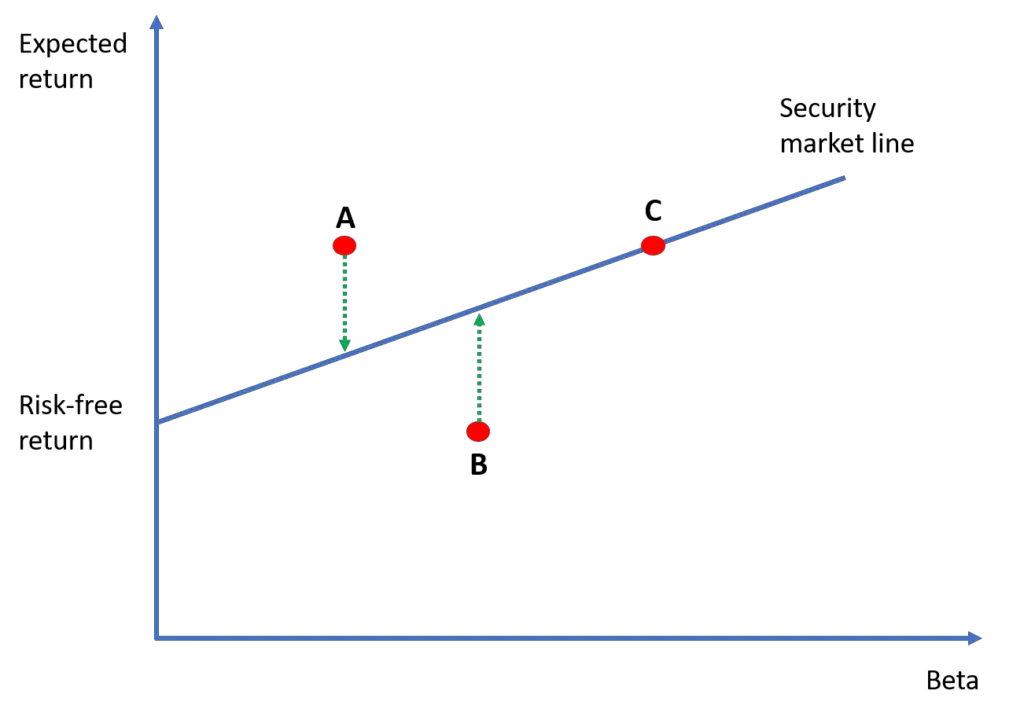
But, what happens if a stock doesn’t lie on the SML? This is illustrated in Figure 3 where there are three stocks: A, B, and C.
According to the CAPM, stock C is correctly priced. Stock A is undervalued because its expected return is higher than what the CAPM predicts. Conversely, stock B is overvalued, because, given its beta level, its expected return should have been higher.
For stock A, we expect investors to form a portfolio that has the same beta but that lies on the SML. They would then go long in stock A and short in the portfolio to earn arbitrage profits (check out our lesson on long position vs. short position if you are unfamiliar with these terms). The purchases of stock A would increase the price of this stock until the mispricing disappears.
For stock B, investors would form a correctly priced portfolio that has the same beta as stock B. This time, they would go long in the portfolio and short-sell stock B to exploit the mispricing. This would put downward pressure on the price of stock B until it goes down to the level predicted by the CAPM.
Therefore, risky assets are expected to lie off the security market line only temporarily because any mispricing is quickly exploited by arbitrageurs whose trades help restore pricing efficiency.
Video summary
If you find the video summary above helpful, pay a visit to our YouTube channel where you can find lots of useful videos on finance and investments: https://www.youtube.com/@initialreturn.
Summary
In this lesson, we have explained that the security market line is a visual representation of the CAPM equation and that it illustrates the linear relationship between expected return and systematic risk. In contrast, the capital market line shows the relationship between expected return and total risk for the combinations of the market portfolio and the risk-free asset. Finally, we have shown that an arbitrage opportunity arises if a risky asset lies above or below the SML. However, such opportunities are expected to be short-lived in competitive markets as arbitrageurs swiftly take advantage of them, leading to their self-destruction.
Further reading:
JYLHÄ, P. (2018), Margin Requirements and the Security Market Line. The Journal of Finance, Vol. 73, pp. 1281-1321.
What is next?
This lesson is part of our free course on investments.
- Next lesson: We will be discussing the arbitrage pricing theory, which entertains the idea of multiple systematic risk factors.
- Previous lesson: We have covered the capital asset pricing model, which has had a profound impact on investment analysis.
If you enjoy reading our content, you can help us by spreading the word within your professional networks. And, if you have got any questions or feedback, you can use our contact form to reach us.