
In a market setting, a limit order book for a particular security (e.g., a stock) is the collection of limit orders (both buy and sell) submitted by traders who are interested in trading that security.
Contents
What does a limit order book look like?
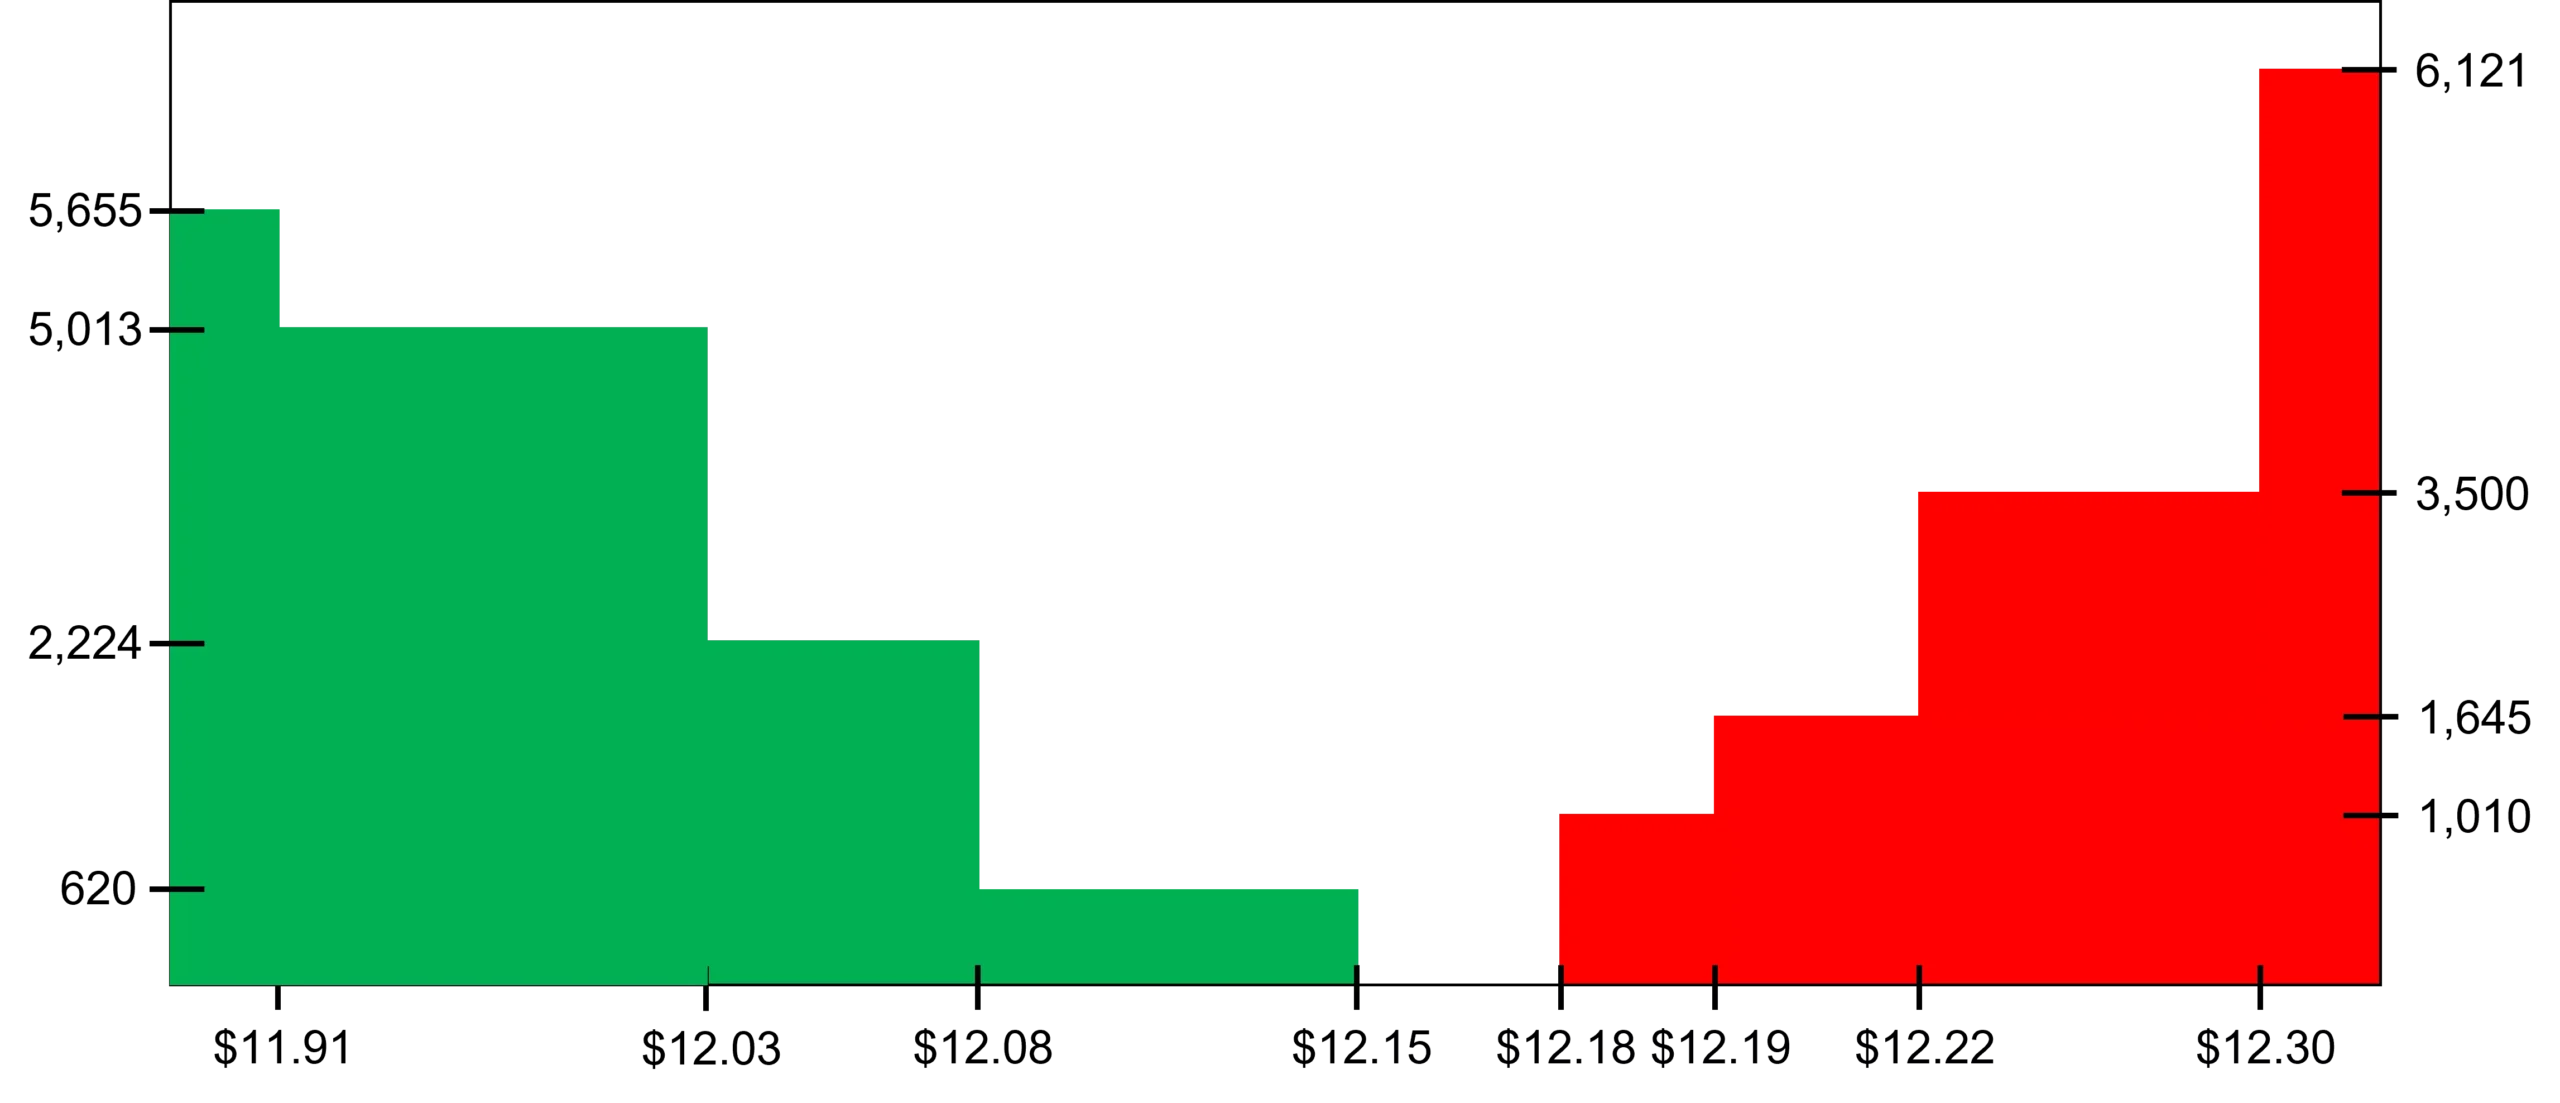
Figure 1 illustrates what a typical limit order book looks like. We have prices on the horizontal axis and quantities on the vertical axis. Indeed, each limit order is essentially a price-quantity pair. For example, we have a limit bid order of 620 shares at $12.15. In general, the left-hand side of the order book (the green bars) represents the buy side of the market and the right-hand side (the red bars) represents the sell side. On the buy side, we have limit buy orders ranging from $11.91 to $12.15. On the sell side, we have limit sell orders in the range of $12.18-$12.30.

We can also present the limit order book in a list format as in Table 1. The information is exactly the same as in Figure 1. The only difference is the presentation.
| Buy orders | | Sell orders | |
|---|---|---|---|
| Bid price | Quantity | Ask price | Quantity |
| $12.15 | 620 | $12.18 | 1,010 |
| $12.08 | 2,224 | $12.19 | 1,645 |
| $12.03 | 5,013 | $12.22 | 3,500 |
| $11.91 | 5,655 | $12.30 | 6,121 |
It is normal to have multiple limit orders at the same price. You might wonder how those orders are executed. Let’s suppose, there are two separate limit buy orders at $12.15: one for 300 shares and another for 320 shares, adding up to 620 shares in total as we see in Table 1. In this case, the two orders would be queued up based on their time of arrival and the order that arrived first would have execution priority. This is known as price-time priority of order matching, but there are other priority mechanisms as well (e.g., price-size priority, which encourages large orders).
Top of the book and the bid-ask spread
You’ll notice in Table 1 that both bid prices and ask prices (a.k.a offer prices) are sorted in ascending order from the top row to the bottom. In fact, the prices in the top row are referred to as the top of the book. Specifically, the highest bid price ($12.15) and the lowest ask price ($12.18), which are the best prices currently available, constitute the top of the book. And, the midprice is the price that is halfway between these two prices, which is ($12.15+$12.18) / 2 = $12.165. Sometimes traders use the term BBO, which stands for best bid offer to refer to the highest bid and lowest ask (or offer) as well.
Furthermore, we call the difference between the best bid and the best ask the bid-ask spread (or quoted spread), which is an important measure of liquidity. In our example, the bid-ask spread is $12.15-$12.18. You can notice that in Figure 1 as the gap between the green bars and red bars.
In general, the lower the bid-ask spread, the more liquid the security is. Why? Imagine that you buy 100 shares at $12.18. This costs you $1,218. Then, you immediately sell those shares back at $12.15, earning yourself $1,215. Your net payoff from these two transactions is $1,215 − $1,218 = −$3, which is a round-trip transaction cost. If the bid-ask spread was narrower (wider), your round-trip transaction cost would be lower (higher). That is why a low bid-ask spread is desirable from a liquidity perspective.
Day order vs GTC (good ’til canceled)
If you submit a limit order as a day order, which may be the default option, your order would disappear from the limit order book at the end of the day (unless it’s executed earlier). However, traders often use alternative order qualifiers. A popular one is called GTC, which stands for good ’til canceled. As the name implies, this keeps the limit order on the book until it’s either filled or canceled. In practice, such orders don’t stay on the limit order book indefinitely, and brokers set them to expire after a couple of months.
Limit order book dynamics
What we see in Figure 1 and Table 1 are the snapshots of a limit order book, which is in fact something really dynamic. That is, new orders (both market and limit) would keep arriving, some of the existing limit orders would be canceled, and the shape of the order book would continue evolving over time.
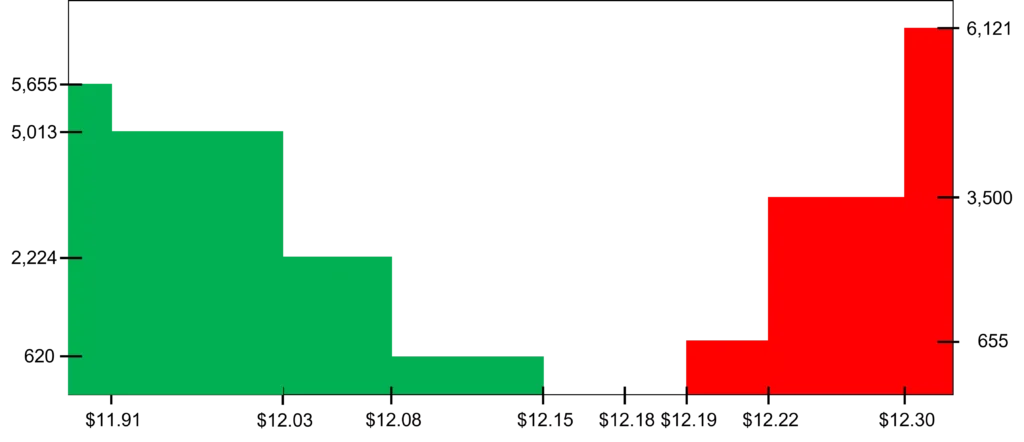
Let’s illustrate this with an example. Suppose that you submit a market order to purchase 2,000 shares. Assuming that no other “action” is going on at that time, here’s how the order book would evolve: You would get 1,010 shares at $12.18 and 990 shares at $12.19. After the execution of this trade, the bid-ask spread would widen to $12.15-$12.19 from $12.15-$12.18 (see Figure 2). There are two things to note here:
- By submitting a market order, you’re taking away liquidity from the market as the bid-ask spread is widening (this was discussed further in a previous lesson).
- Because of the size of your order, part of your order is filled at a price higher than the lowest ask. This relates to order book depth as discussed below.
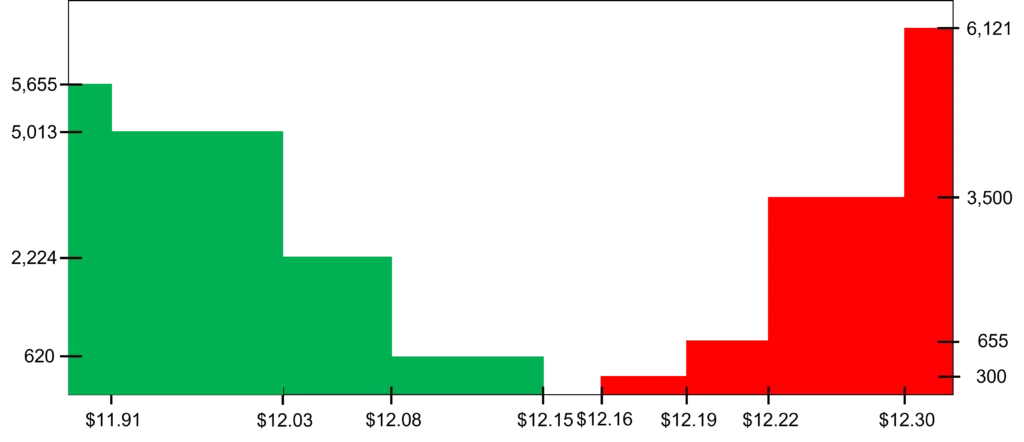
Let’s consider another example. Following the execution of your market order, you decide to place a limit order to sell 300 shares at $12.16. This order wouldn’t be immediately executed, but it would become the new lowest ask, narrowing down the bid-ask spread to $12.15-$12.16 from $12.15-$12.19 (see Figure 3). Again, note the following:
- By submitting a competitive limit order, you’re providing liquidity to the market as the bid-ask spread is narrowing down (see this lesson for further discussion).
- Because your limit order is at the top of the book, you can expect it to be executed soon. If you had submitted a limit order far away from the midprice, it could have taken a long time for that order to be executed. In fact, it may have never been filled if the price moved in the opposite direction.
Order book depth
The order book depth is about the volume of quantities offered at different price levels. In general, an order book could be considered as deep if there are large quantities of buy and sell orders on offer, especially not too far from the top of the book. For example, if we look at Figure 3, we observe that there is more depth near the highest bid (620 shares) compared to the lowest ask (300 shares).
Like the bid-ask spread, the order book depth is a dimension of liquidity. In particular, when the order book is not deep near the bid-ask spread, large orders can be expected to have significant price impact. For example, looking at Figure 3, a market order to buy 1,000 shares would shift the bid-ask spread from $12.15-$12.16 to $12.15-$12.22 following the execution of that order. If a limit order book is sufficiently deep near the bid-ask spread even relatively large orders can be handled with a relatively small price impact, which is desirable from a liquidity perspective.
Slippage
Let’s suppose the current bid-ask spread is $12.15-$12.16 as shown in Figure 3, and you submit a market order to sell 500 shares. Given that the quantity bid at $12.15 is 620 shares, you hope that your order would be filled at this price. But, sometimes this may not happen. Specifically, the bid-ask spread may shift before the execution of your market order. This is known as slippage.
For instance, another market sell order may be executed just before yours moving the highest bid down to, say, $12.08. In this case, you’re experiencing negative slippage as you will end up selling your share at $12.08 instead of $12.15.
Alternatively, imagine several limit orders arrive ahead of your market order shifting the bid-ask spread to $12.18-$12.20. Now, you’re experiencing positive slippage as you will be able to sell (at least some of) your shares at $12.18 instead of $12.15, which was the original highest bid.
Video summary
Summary
It this lesson, we have given a detailed characterization of limit order books. These are collections of limit buy and limit sell orders. A tight bid-ask spread and order depth are both desirable characteristics from a liquidity perspective.
Further reading:
Foucault, Kadan, and Kandel (2005), “Limit Order Book as a Market for Liquidity“, The Review of Financial Studies, Vol. 18(4), pp. 1171-1217.
What is next?
This lesson is part of our fundamentals of trading course.
- Next lesson: We’ll elaborate on what an arbitrage opportunity is and will cover different forms of arbitrage strategies.
- Previous lesson: We explained the difference between long positions and short positions.
We’re always keen to learn our visitors’ views about our content. If you’ve got any feedback for us, you can reach us here.