
Treynor ratio is a popular risk-adjusted performance measure. It gets its name from the American economist Jack Treynor who came up with this measure in the mid-1960s (see the full reference at the end). It is a measure of how much “excess return” (i.e., return above the risk-free rate) a security (stock, bond, mutual fund, etc.) offers per unit of systematic risk, which is captured by beta. In that sense, it is a reward-to-risk ratio like the Sharpe ratio.
Contents
Treynor ratio formula
We can write the Treynor ratio formula for an asset i (e.g., stock, portfolio, fund, etc.) as follows:
where Ri is the return on the asset, Rf is the risk-free rate of return, and βi is the beta of the asset, which is based on CAPM.
To give a specific example, suppose that mutual fund A yielded a return of 12% last year. Over the same period, the yield on treasury bills, which we take as a proxy of the risk-free rate, was 3%. Let’s also assume that fund A’s beta was 2. Then, we can easily calculate fund A’s “realized Treynor ratio” as:
TA = (12% − 3%) / 2 = 4.5%
This means that fund A yielded a return of 4.5% for each unit of systematic risk borne.
Now, let’s imagine that fund A’s beta will remain to be 2, its expected return is 15%, and the risk-free rate for the next year is 5%. Then, the “expected Treynor ratio” for this mutual fund would be:
TA = (15% − 5%) / 2 = 5%
If mutual fund B expects to have TA = 3%, then we can consider A to be a better investment opportunity than B. This is because A offers a higher reward than B per unit of systematic risk carried.
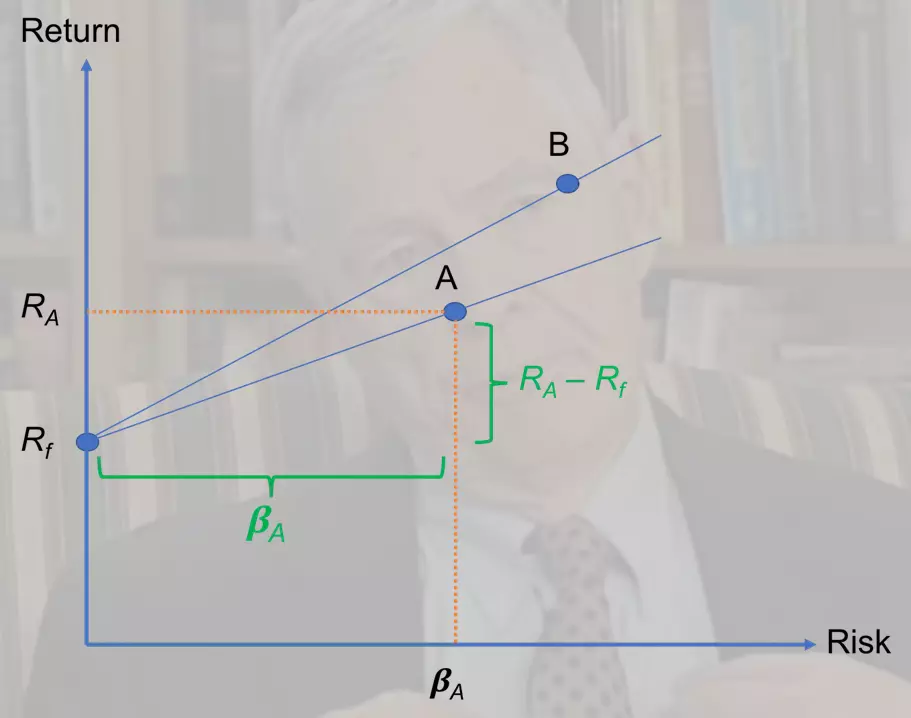
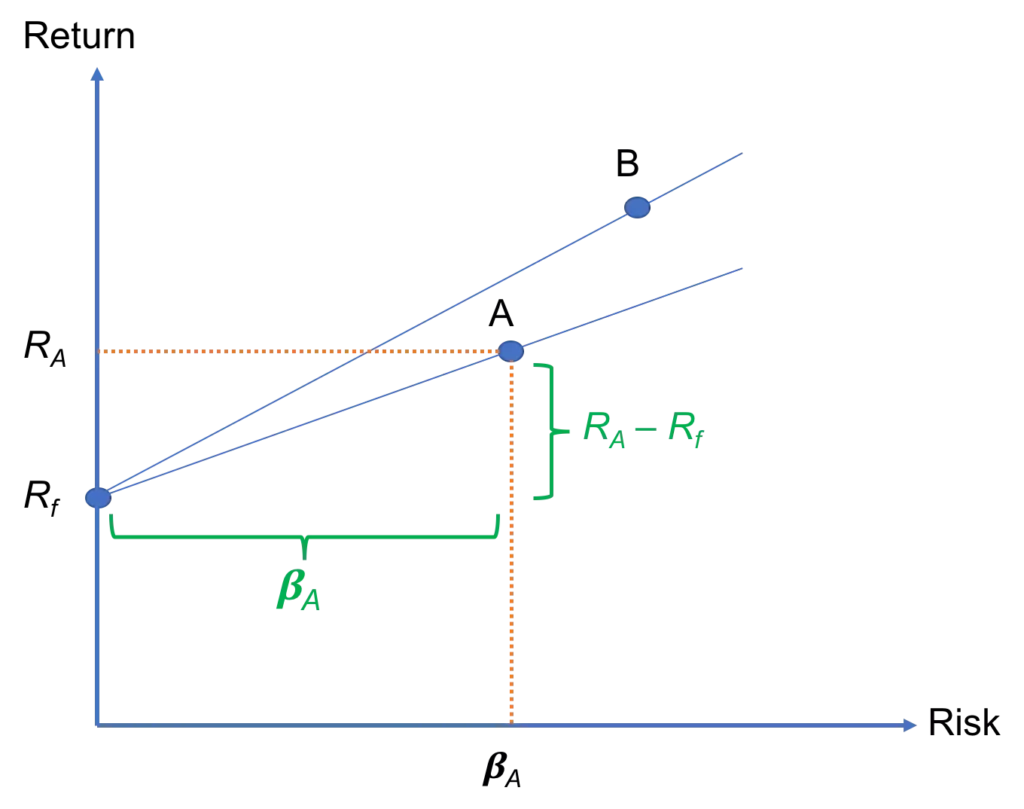
We can also interpret the Treynor ratio visually by means of a plot of (systematic) risk against return. In Figure 1, we have two risky assets (e.g., stocks or funds): A and B, and the risk-free asset, which yields Rf.
For both A and B, we can draw a line that connects the risky asset with the riskless one. Then, the Treynor ratio is simply the slope of that line. In this case, TB > TA because of the steeper slope.
Treynor ratio calculator

In order to use the Treynor ratio calculator, you would need to enter the following information:
- The return on the risky asset.
- The return on the riskless asset.
- The beta of the risky asset.
If you need to estimate beta, you can do that by regressing the returns on the asset you are interested in on the returns on a broad-based market index such as the S&P 500. Alternatively, financial data providers such as Yahoo! Finance provide beta estimates.
Summary
Despite being developed in the 1960s, the Treynor measure remains one of the most popular reward-to-risk measures that is used by practitioners and academics alike to this date. It tells us about the excess return an asset yields per unit of systematic risk borne. Therefore, the higher it is, the better the investment performance.
Further reading:
Treynor (1965) ‘How to Rate Management of Investment Funds,’ Harvard Business Review, Vol. 43(1), pp. 63.
What is next?
This was the final lesson in our online course on investments. Next, we offer an investments quiz to help you test your understanding of the material covered in the course.
We hope you have found this lesson useful. If you have any feedback for us, you can reach us here. Please feel free to share our content in your networks to spread the word.