
Sharpe ratio is among the most widely used performance evaluation metrics in the fund management industry. It is a reward-to-risk ratio, such that it captures the (excess) return an asset (e.g., stock) generates per unit of (total) risk, which is measured by return volatility. It was developed by Nobel laureate William F. Sharpe, who is one of the pioneers of CAPM, back in the 1960s.
Contents
Sharpe ratio calculator

You need the following inputs to use our Sharpe ratio calculator:
- the return on the risky asset,
- the standard deviation of returns on the risky asset,
- the risk-free rate.
The standard deviation of returns represents total risk and should be a positive number.
Sharpe ratio formula
The Sharpe ratio formula can be written as follows:
where Ri is the return on asset i, Rf is the risk-free rate of return, and σi is the standard deviation of returns on asset i. σi is a measure of total risk and reflects return volatility.
To give a real-world example, over the course of the last century, the average excess return on the value-weighted index of US stocks was about 8.5% with a volatility of 20%, approximately (you can find the raw data in Kenneth R. French’s data library). Based on these figures, we have SM = 8.5% / 20% = 0.425 for the US stock market. Of course, during this long period, you can even find episodes when SM was negative or when it exceeded the value of one.
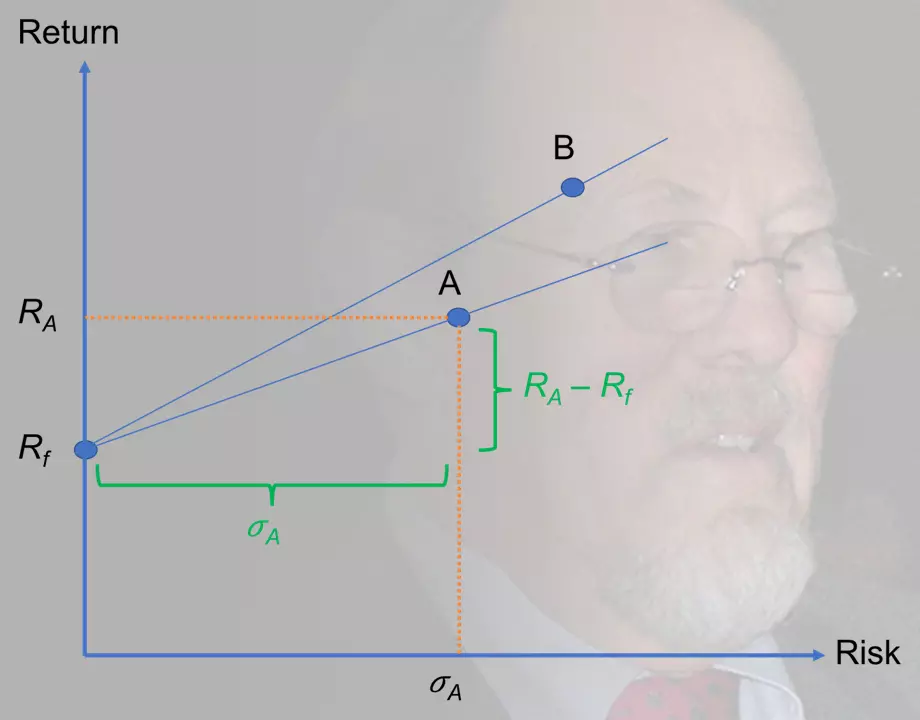
In Figure 1, we offer a visual interpretation, using a plot of return against risk. Each point on this plot represents a risky asset, such as a stock, mutual fund, etc. And, we have the risk-free asset, which has a return of Rf, on the vertical axis.
We can connect each risky asset to the risk-free asset through a straight line. In Figure 1, we have done that for two stocks: A and B. The Sharpe ratio of stock A is simply the slope of the line that connects it to the risk-free asset:
SA = (RA − Rf) / σA
The same is true for Stock B as well. And, the steeper the slope, the higher the Sharpe ratio. This means that SB > SA.

Summary
In this lesson, we introduced Sharpe ratio as a popular tool for evaluating investment performance. It is essentially a reward-to-risk ratio, where the excess return in the numerator captures the reward and the return volatility in the denominator reflects risk.
Further reading:
Sharpe (1966) ‘Mutual Fund Performance,’ The Journal of Business, Vol. 39 (1), pp. 119-138.
What is next?
This lesson is part of our free course on investments.
- Next lesson: We will cover Treynor ratio, which is another popular reward-to-risk ratio.
- Previous lesson: We have discussed Jensen’s alpha, which is an important risk-adjusted performance measure that is closely related to popular asset pricing models such as the CAPM and APT.
If you have any feedback for us (including questions about our content), you can use this contact form to get in touch. We’d love to hear your thoughts!