
Liquidity is a fundamental concept in finance and trading. But, what is liquidity in stocks in particular and financial markets in general? A liquid stock can be traded easily in relatively large volumes without affecting its price in the market. In contrast, illiquid stocks are traded thinly, such that it may be difficult to find buyers/sellers who are willing to trade large quantities at quoted prices.
Let’s expand on the concept of liquidity further. When we discussed the limit order book in a previous lesson, we paid special attention to two concepts: bid-ask spread and order book depth. In general, a liquid stock would have a low bid-ask spread and a large volume of limit orders waiting to be executed in the vicinity of the bid-ask spread, implying a deep order book. A low bid-ask spread reduces round-trip transaction costs, whereas depth near the bid-ask spread ensures that large market orders can be absorbed with minimal price impact.
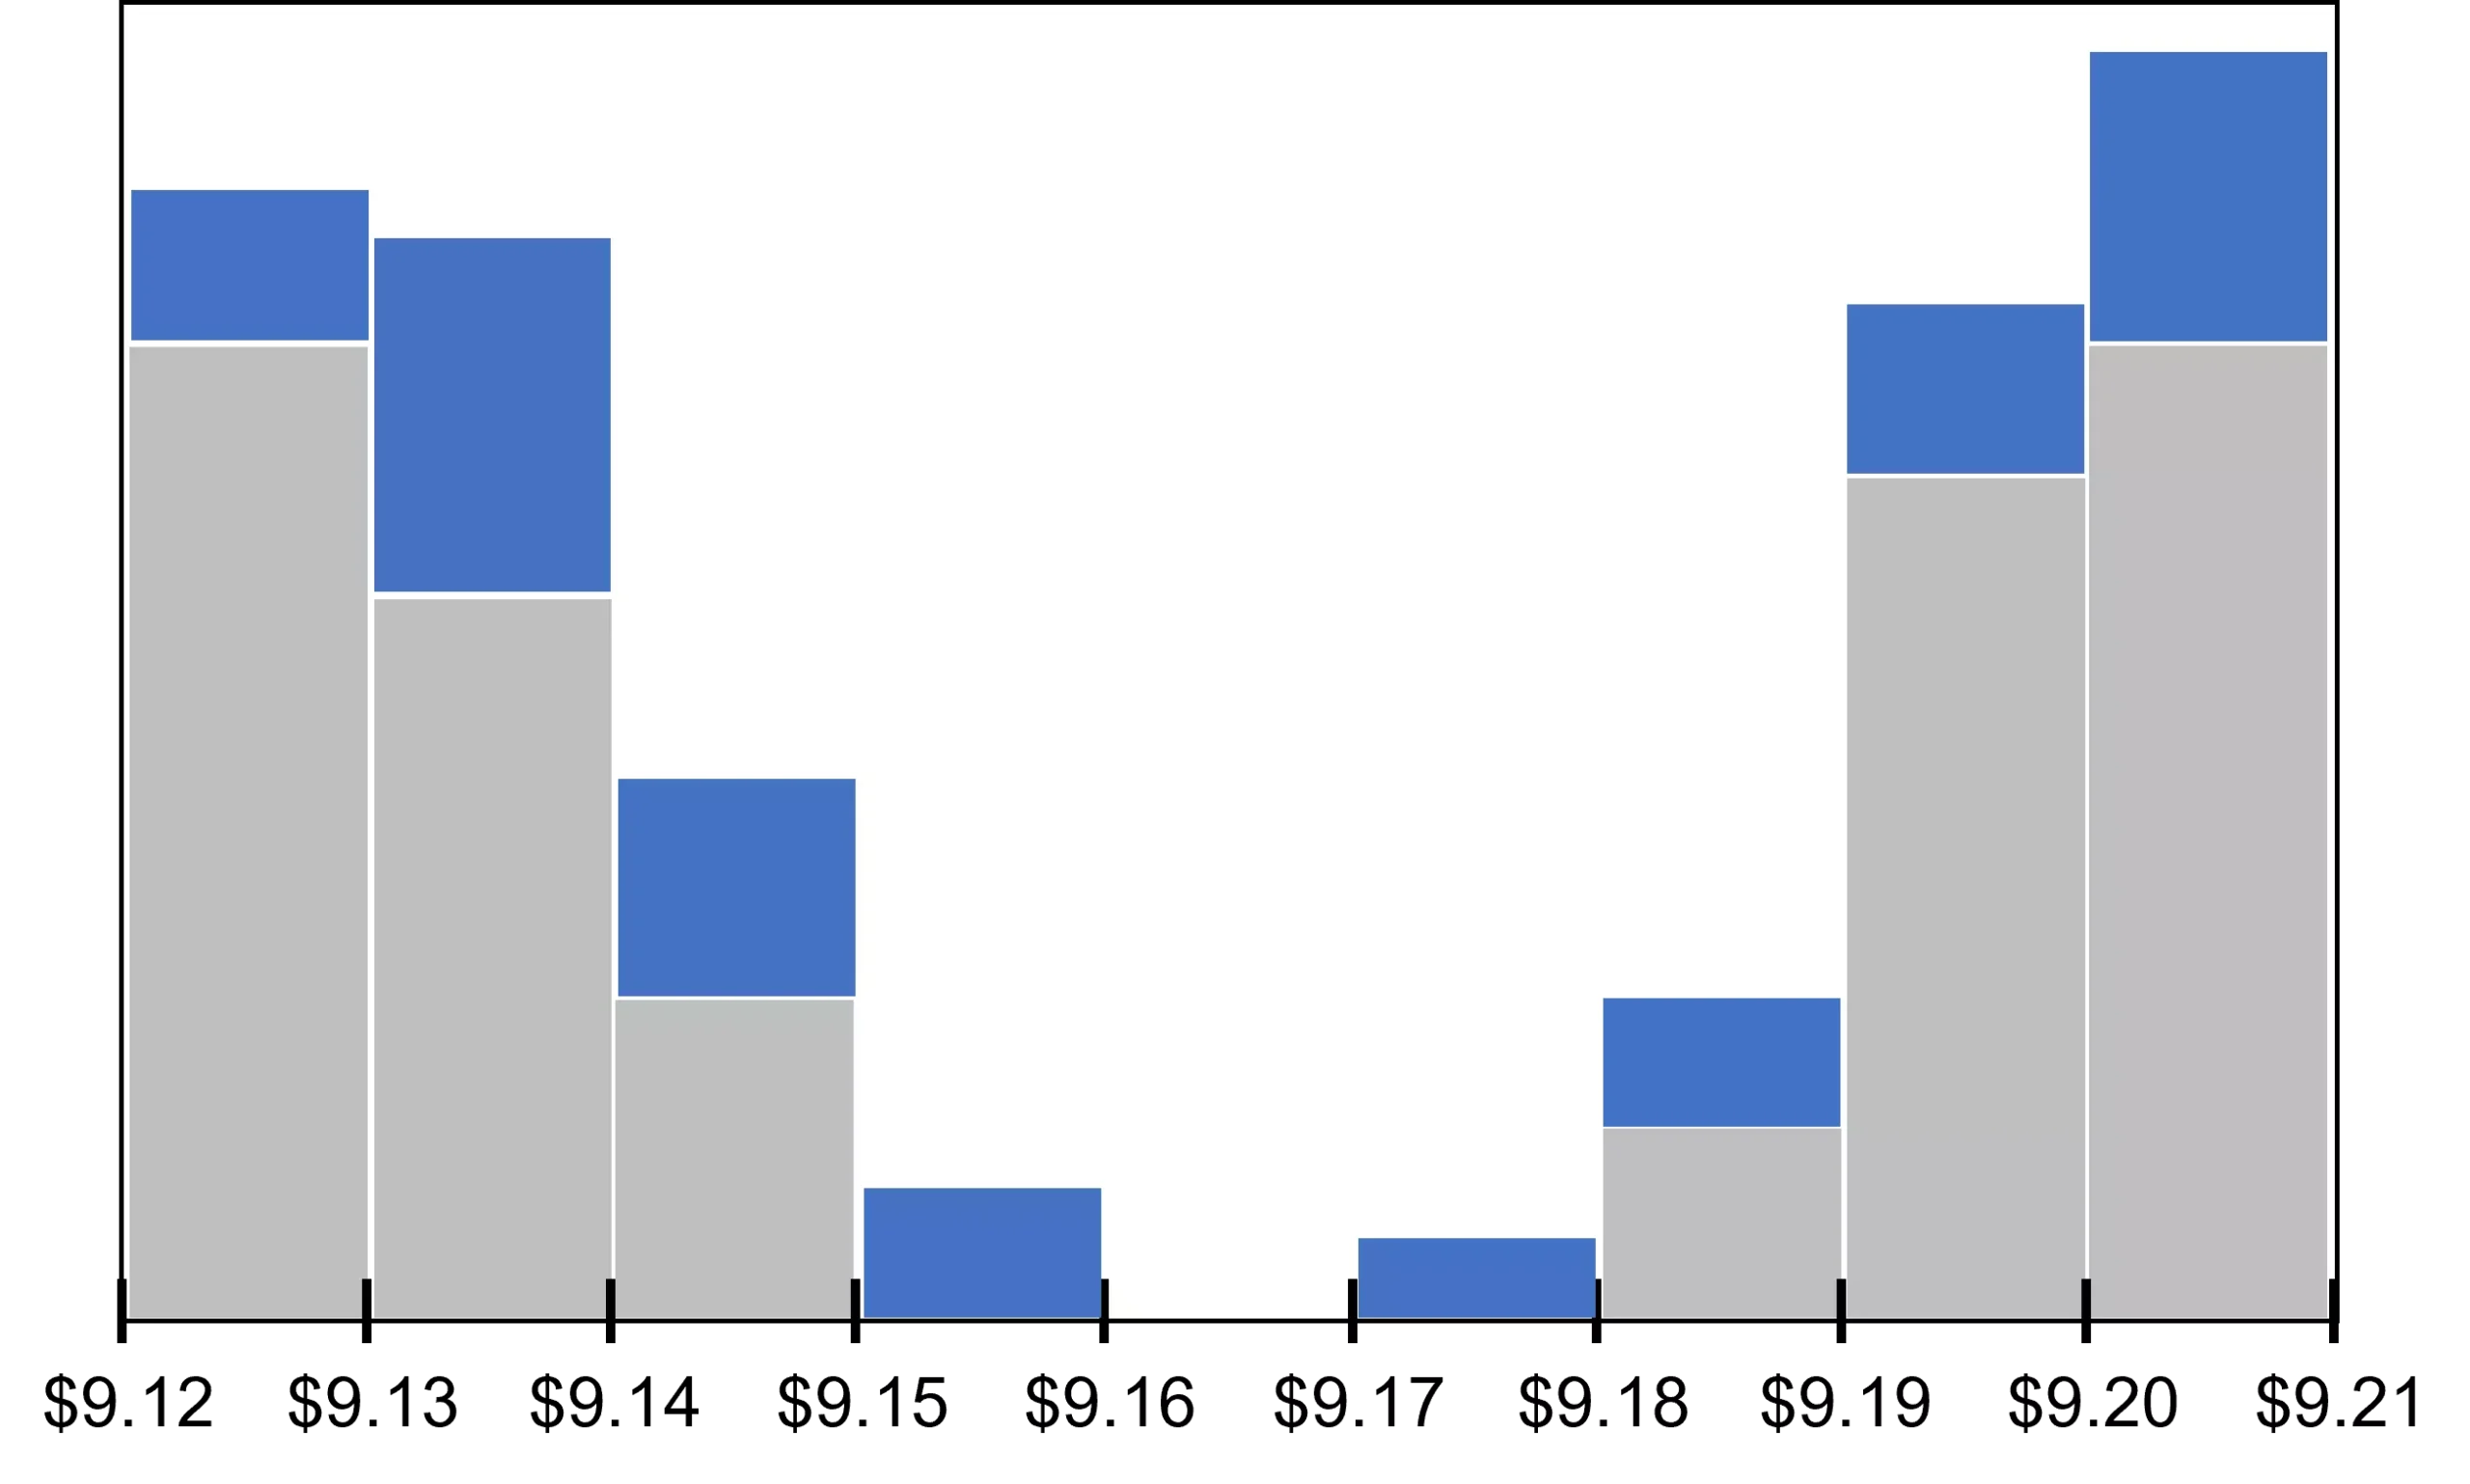
To give a specific example, consider the limit order books shown in Figure 1. Stock A is represented by gray bars whereas stock B is represented by the sum of gray bars and blue bars. Stock B is more liquid than stock A for two reasons:
- It has a tighter bid-ask spread ($9.16-$9.17 for B vs $9.15-$9.18 for A).
- It has larger quantities of shares available for trade at each price level.

The differences between liquid stocks and illiquid stocks are summarized in Table 1. Note that these differences apply to any asset class, and not just stocks. In the remaining part of this lesson, we delve deeper into the dimensions of liquidity.
| Characteristics | Liquid stocks | Illiquid stocks |
|---|---|---|
| Number of buyers/sellers | High | Low |
| Trading volume | High | Low |
| Bid-ask spread | Tight | Wide |
| Price impact of market orders | Small | Big |
| Price recovery from random shocks | Fast | Slow |
Contents
Dimensions of liquidity
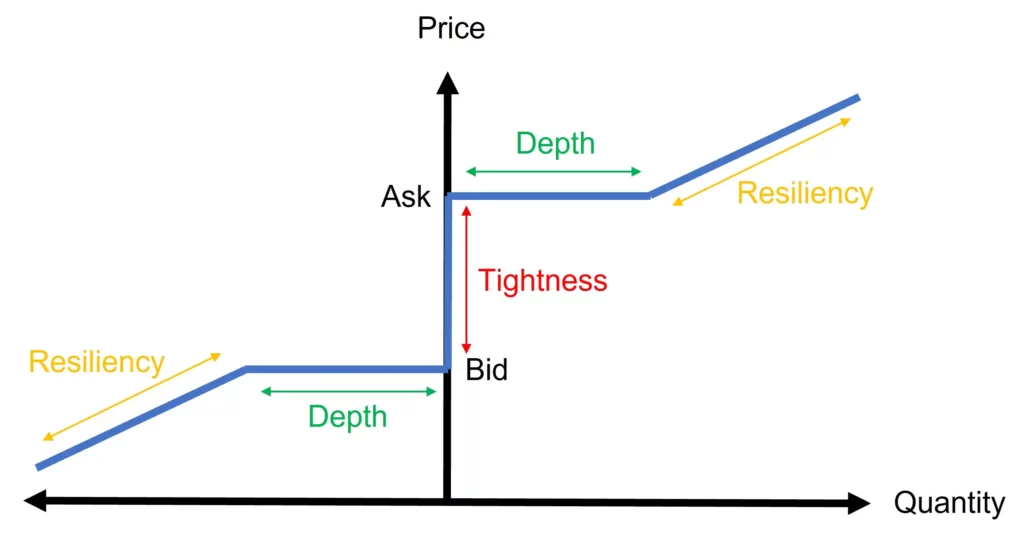
In a seminal paper (full reference here), American economist Pete Kyle labels market liquidity as a “slippery and elusive concept” and presents three dimensions of liquidity:
- Tightness
- Depth
- Resiliency
These dimensions are illustrated in Figure 2 below. We’ll now discuss them one by one.
Tightness
Tightness is related to the bid-ask spread, which is a cost of trading for investors and a source of revenue for market makers (see our lesson on bid prices versus ask prices for further details).
In general, a market can be called liquid in terms of its tightness if bid-ask spreads are low in that market. This is indeed the case for competitive stock markets such as the NYSE, NASDAQ, London Stock Exchange, etc. The bid-ask spread captures the round-trip transaction cost we discussed earlier. More specifically, if you buy some shares at the market price and sell them back immediately, the cost you incur is equal to the size of the bid-ask spread.
We would expect stocks with large trading volumes to score better in terms of tightness compared to, for example, penny stocks with thin trading.
Depth
A stock is also regarded as liquid if large market orders can be fulfilled without a significant impact on the market price. This is the depth dimension of stock liquidity and is related to the concept of price impact.
To give a practical example, suppose stocks A and B have the same lowest ask price of $10. Let’s also assume there are 10,000 shares available at this price for stock A and 1,000 shares for stock B.
This means that a market buy order of, say, 5,000 A shares could be fulfilled at $10 as there is a sufficient quantity of A shares available at this price. However, a market buy order of 5,000 B shares could only be partially filled at $10. In this case, the investor would get 1,000 B shares at $10 and would have to pay more than $10 for the remaining 4,000 B shares. And, after the execution of these market orders, the lowest ask would remain at $10 for stock A but would be higher for stock B.
In general, the larger the market orders that can be fulfilled with little impact on the market price, the more liquid the stock is.
Resiliency
Resiliency can be defined as the speed with which the price of a stock would recover from a random shock, which is not value-relevant. Liquid stocks are resilient in the sense that the speed of recovery is fast.
To explain the concept, let us assume the highest bid for a stock is $10 at the moment. Let’s also imagine, a few institutional investors submit a series of large market sell orders that pull the highest bid down to $9 after execution.
To the extent that these orders were submitted to satisfy the liquidity needs of these institutional investors, they carry no information about a change in the value of the stock. In other words, these investors did not sell their shares because of any negative news or information about the firm.
In this case, we can expect the price to revert to $10 as the price drop was due to an uninformative shock. And, the more resilient the stock is, the quicker the price would bounce back to $10.
Summary
What is liquidity in stocks? This’s the question we address in this lesson. We’ve explained that liquidity is all about the ability to trade a stock (or any other security) in large quantities without a long wait and/or significant impact on its price. We’ve also discussed tightness, depth, and resiliency as the key dimensions of liquidity.
Further reading:
Kyle (1985), ‘Continuous Auctions and Insider Trading‘, Econometrica, Vol. 53, No. 6, pp. 1315-1335.
What is next?
This lesson is part of our course on the fundamentals of trading.
- Next lesson: We will be focusing on the psychology of trading.
- Previous lesson: We discussed what is meant by an arbitrage opportunity in financial markets.
If you have enjoyed reading this post, consider sharing it with your friends and colleagues on social media platforms. If you have any questions or suggestions for us (including spotted errors), let us know by leaving a comment here.