
Tag: excel
-

Minimum variance portfolio
In this lesson, we explain what is meant by the minimum variance portfolio (MVP), derive its formula for the two-asset case, and provide an online calculator as well. You can also check out our video tutorial to learn how to find the position of the MVP on the efficient frontier using Excel’s solver tool. And,…
-
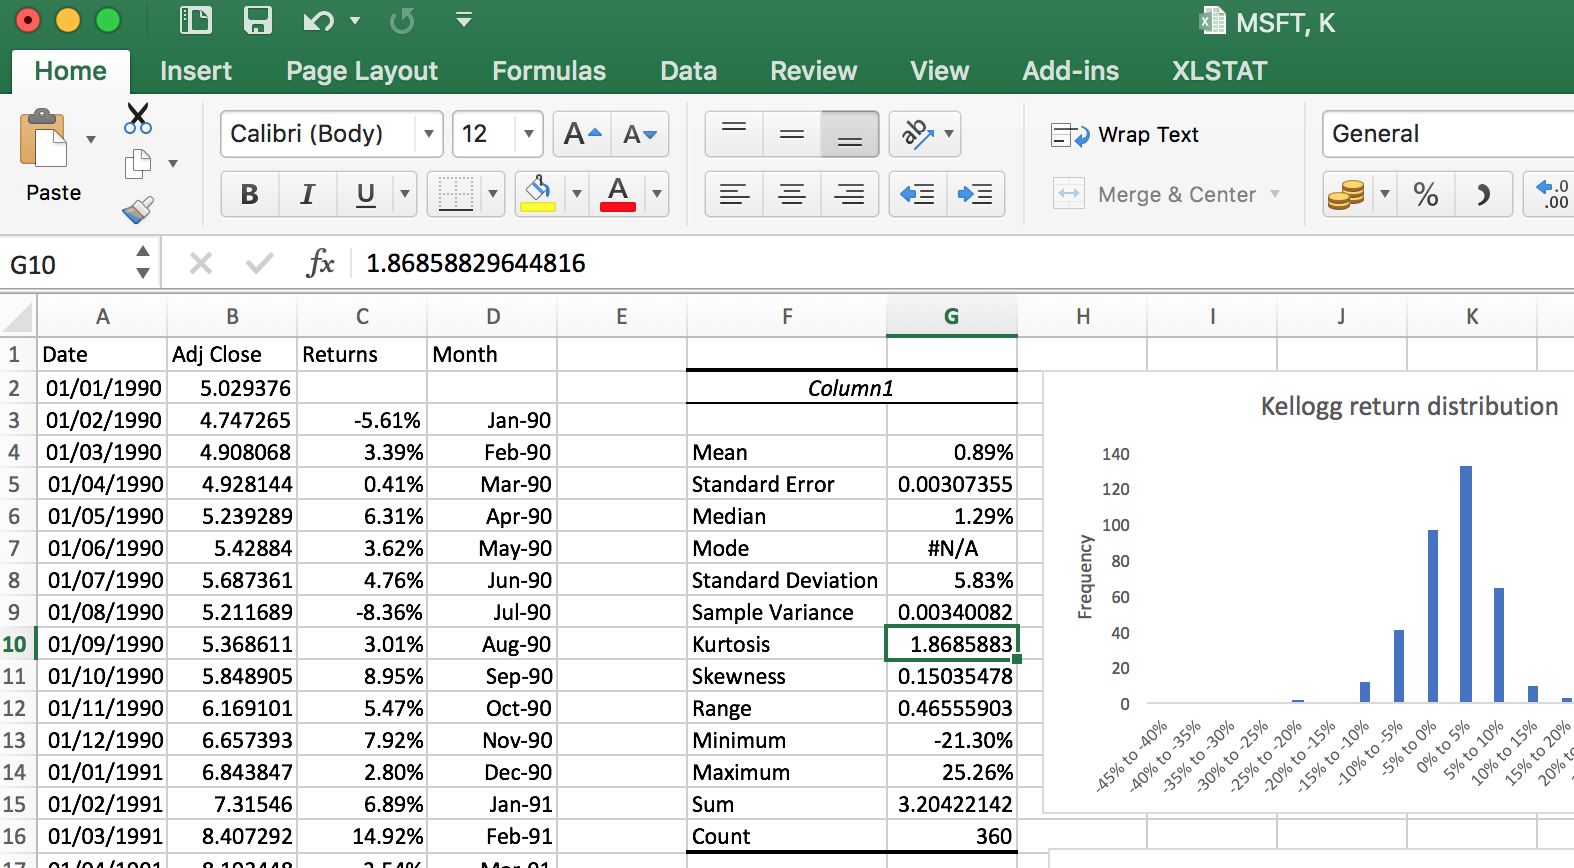
Descriptive statistics for stock returns
Descriptive statistics offer a simple way of understanding distributions of stock returns. They give us an idea about a distribution’s centrality, dispersion, and other features. In this tutorial, we will show you how to generate descriptive statistics for stock returns using Excel’s data analysis tool. Using Excel to get descriptive statistics for stock returns What…
-
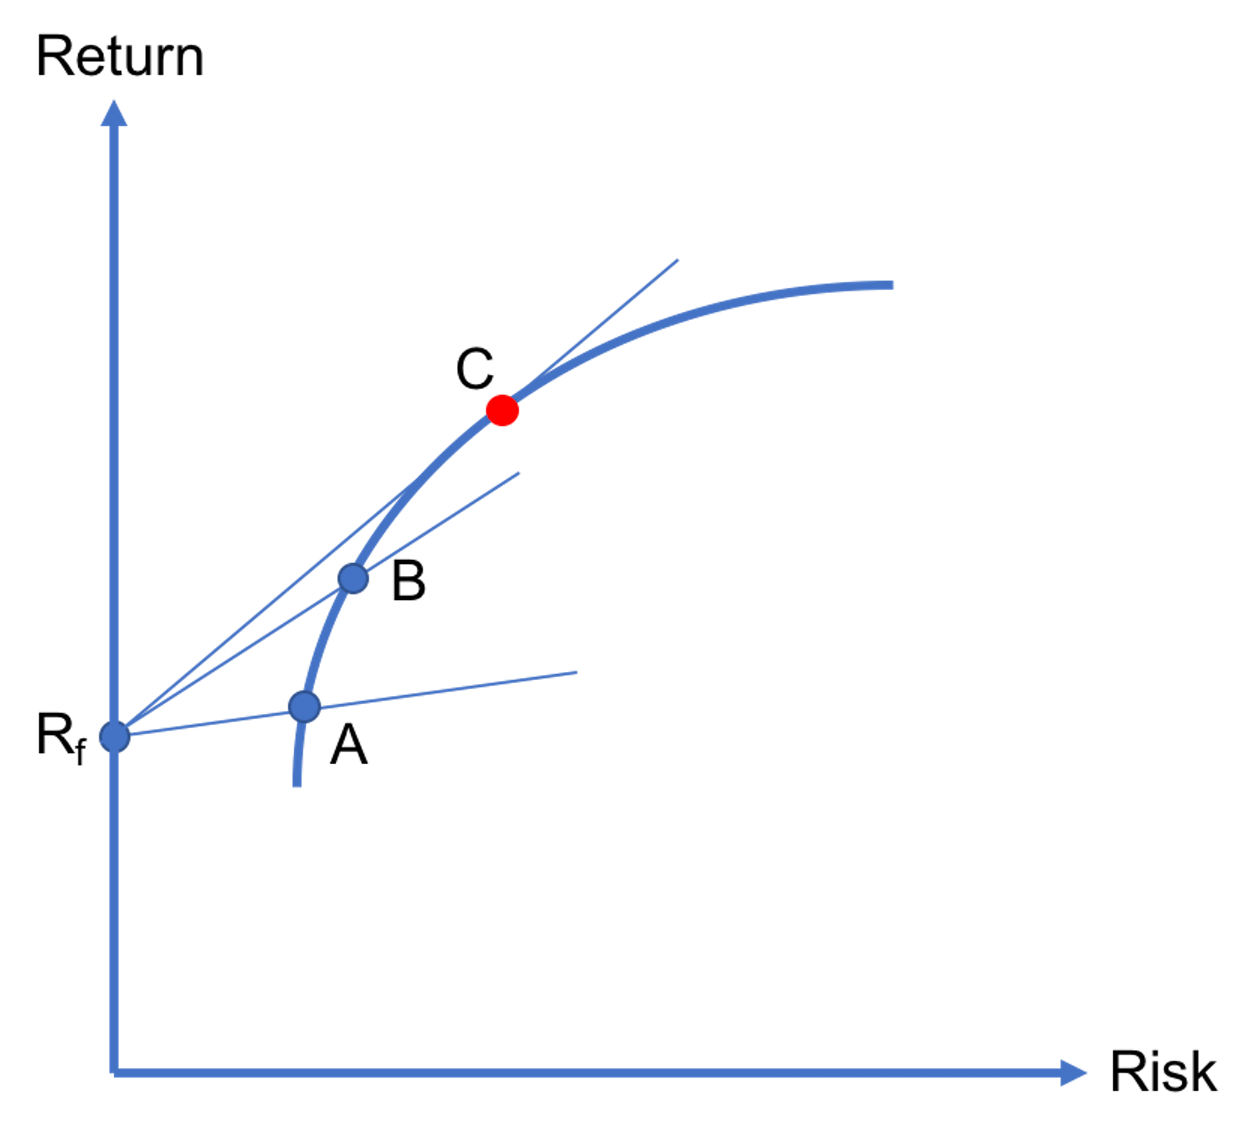
Optimal risky portfolio
In previous lessons, we explained that when there is no risk-free asset in an economy, investors should invest in one of the portfolios that lie on the efficient frontier based on their risk tolerances. But, if a risk-free asset exists, then there is a unique portfolio that all investors should invest in. In particular, the…
-
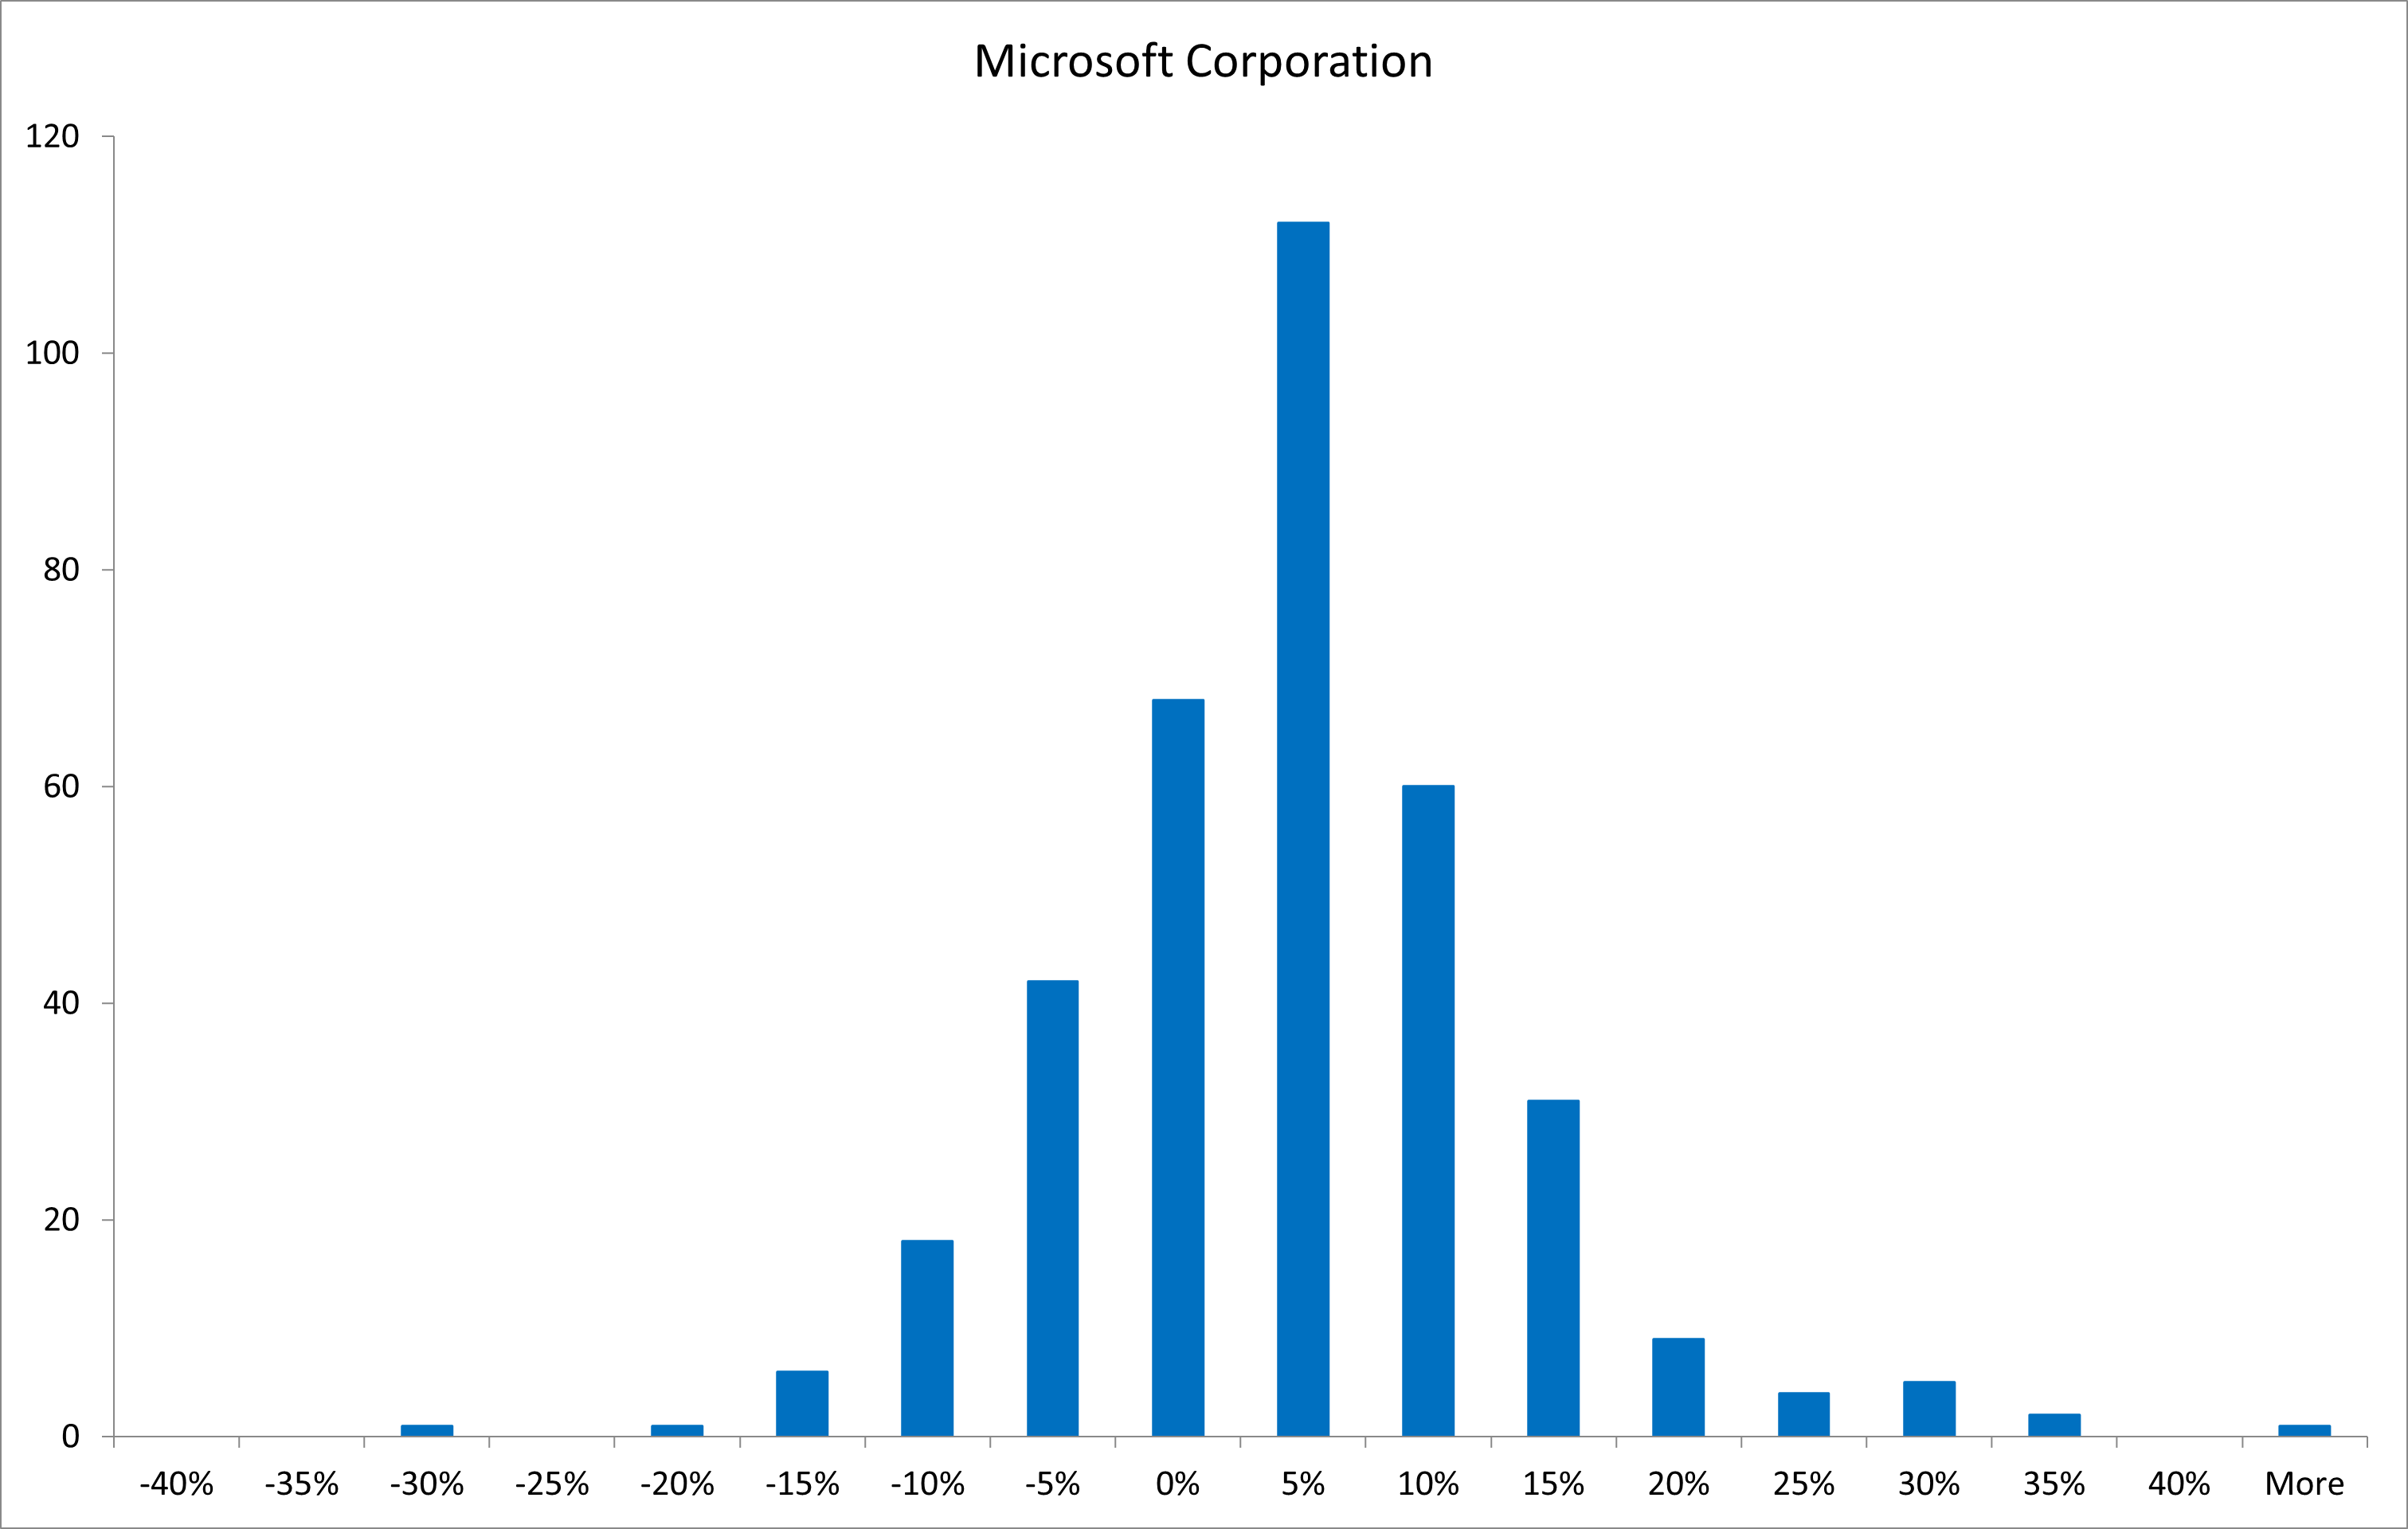
Creating a histogram of stock returns with Excel
An easy way to visualize the distribution of stock returns is to plot a histogram. In this tutorial, we will teach you how to create histograms of stock returns using Excel and explain how to interpret them. Using Excel’s “data analysis” tool to plot a histogram We’ll be working with the monthly returns of two…
-
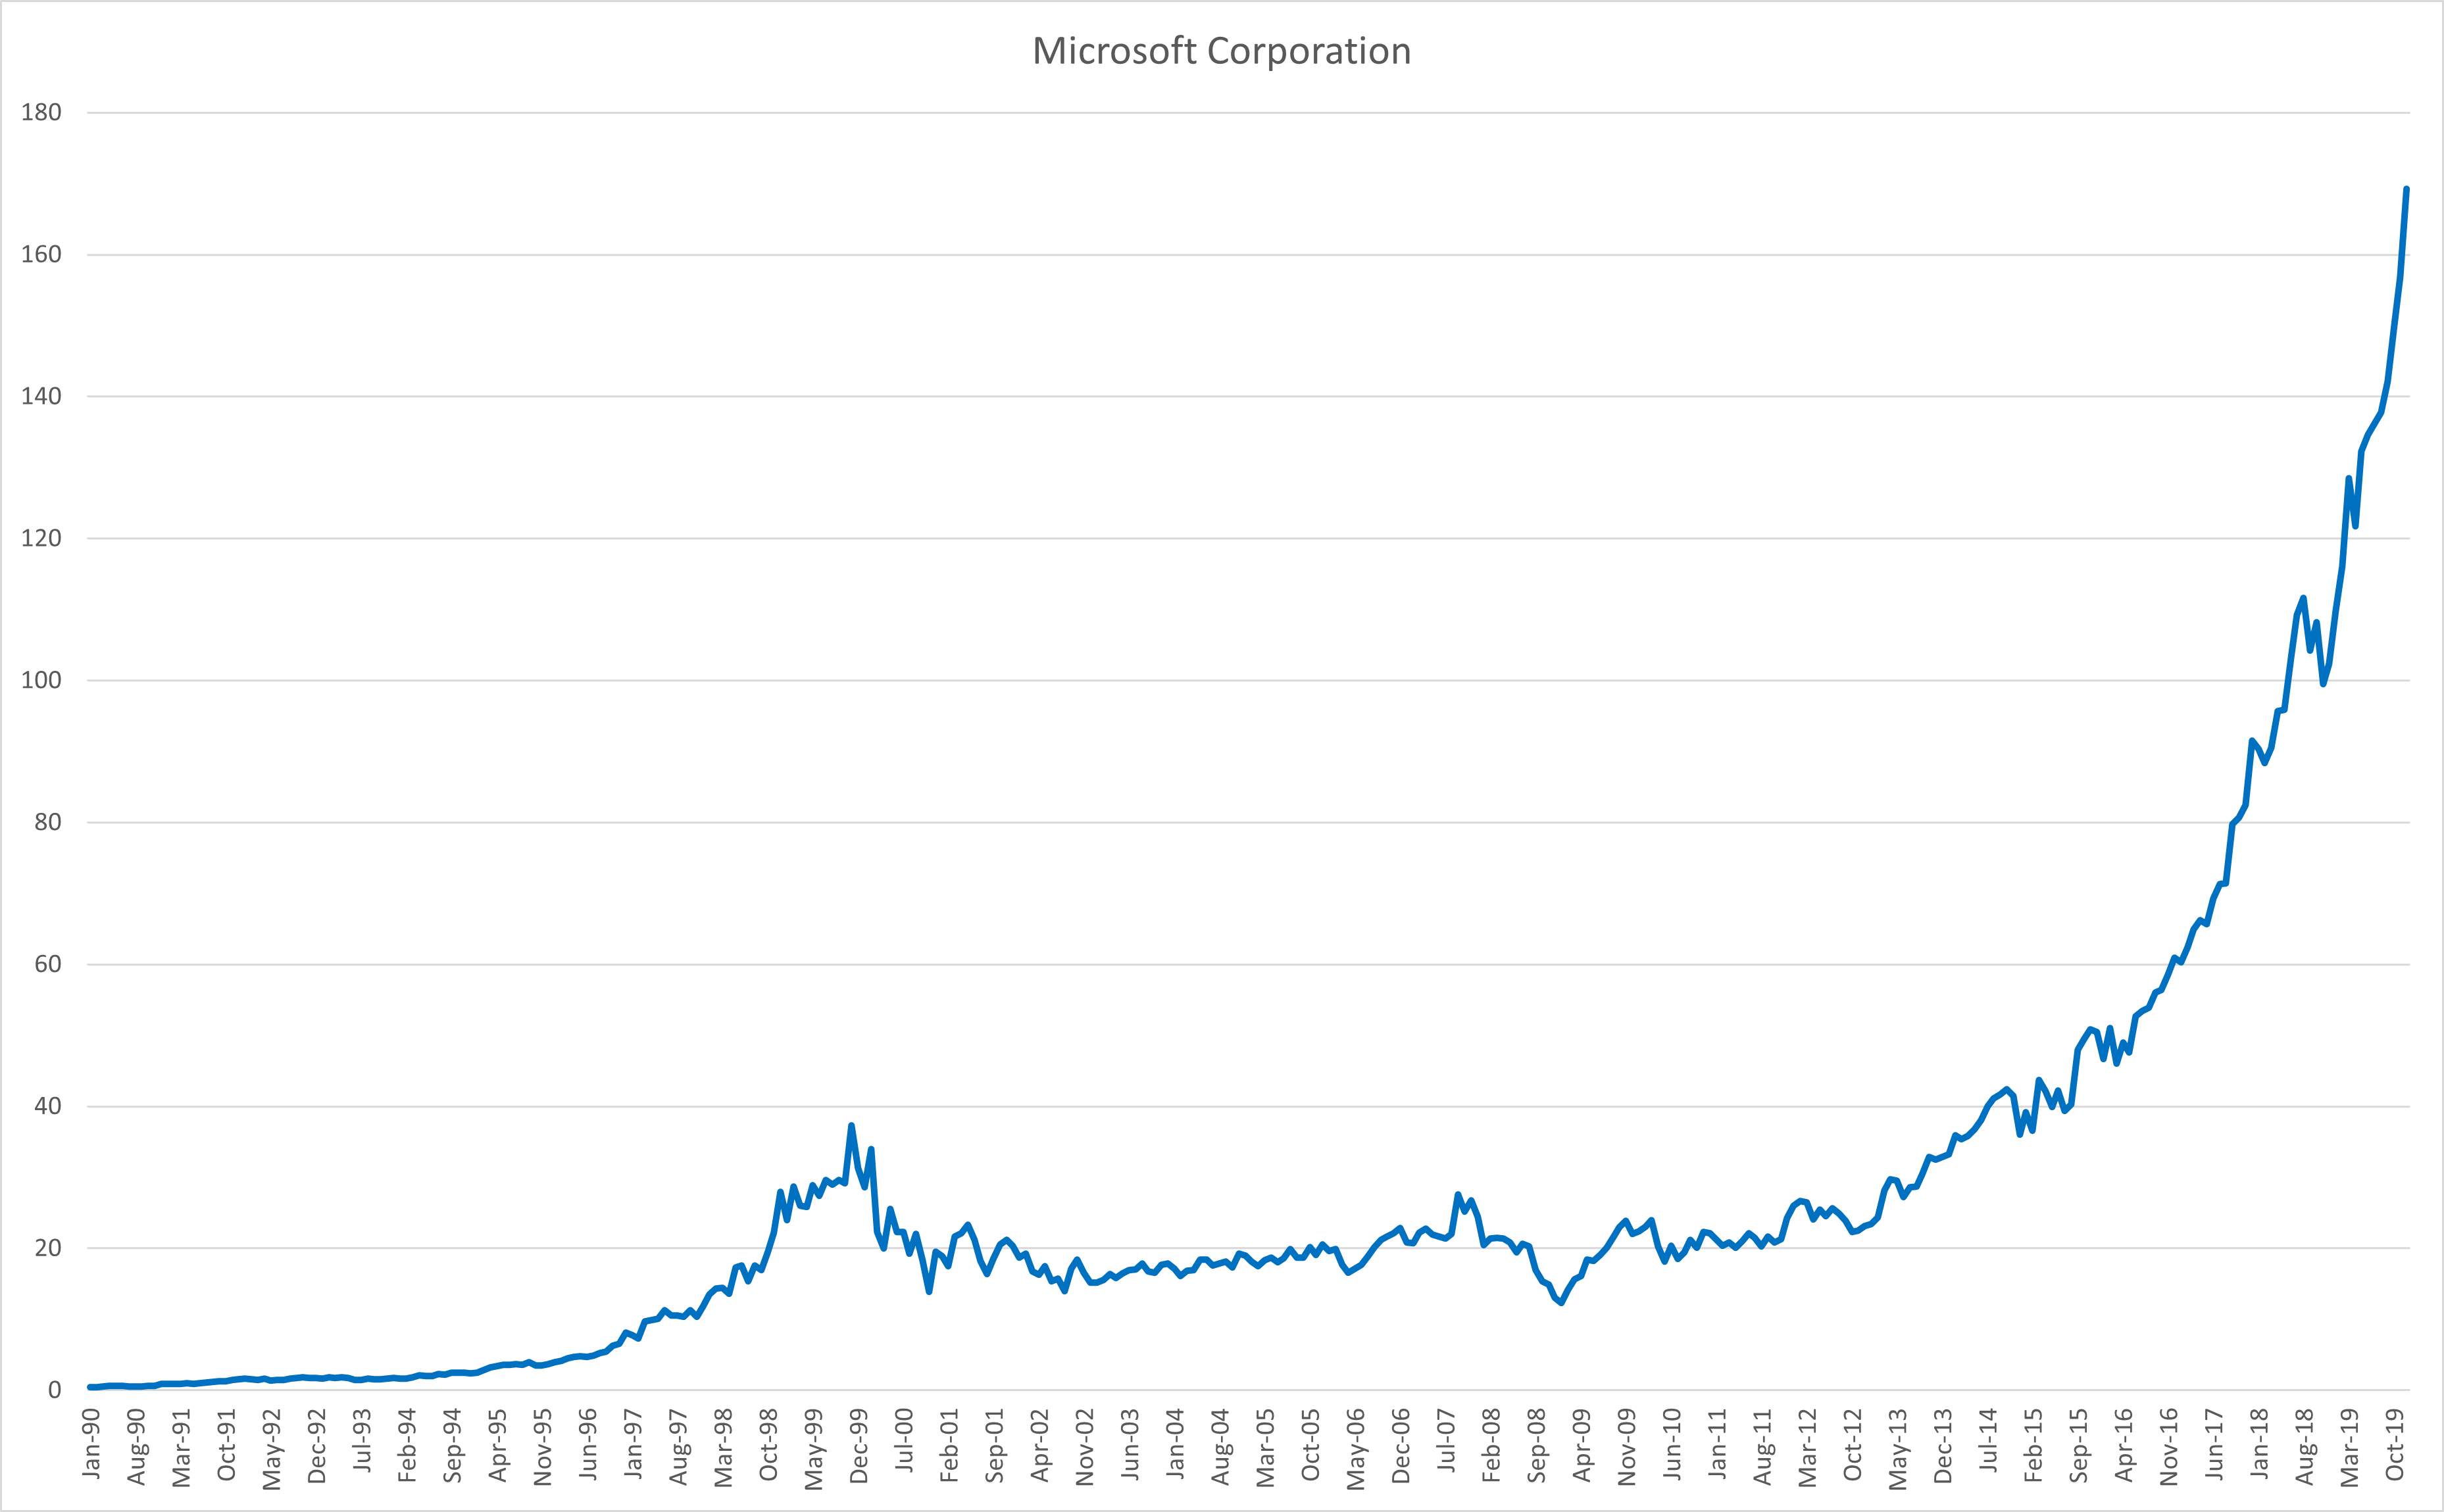
Plotting stock prices and returns
In this tutorial, we’ll teach you how to plot time series of stock prices and returns using Excel. We’ll explain how to interpret these plots as well. We’ve chosen to examine Microsoft (MSFT) and Kellogg (K) shares for the 30-year period between January 1, 1990 and January 1, 2020. The data is obtained from Yahoo! Finance…