Initial Return is the product of a collaboration between finance professionals, academics, and investors. We produce high-quality, educational content for investors, traders, and finance students.
Real return vs nominal return: How do they differ from one another? Suppose that an asset yields a return of 50% over a year. So, if you invest $10,000 today, your investment grows to $15,000 by the end of the year. Sounds not too bad, right? But, imagine that the inflation rate over the course…
Investing is all about realizing a positive return. But, how do you calculate returns? In this post, we discuss the fundamentals of return calculations. We begin by explaining why investors are interested in calculating returns. Then, we teach you how to calculate gross returns and net returns. We discuss the concept of total return as…
An arbitrage opportunity arises when an asset is mispriced, giving traders a chance to make money. In the case of pure arbitrage, the opportunity carries no risk. The same can’t be said for statistical arbitrage and risk arbitrage, both of which involve risk. All forms of arbitrage opportunities are based on a buy low, sell…
It is easy for beginner traders to get lost when listening to conversations by seasoned traders. Trading involves lots of technical terms and specific jargon. For example, what does it mean to be “long” or “short” in a stock or option? This comes down to the following dichotomy: long position vs short position. In a…
It’s easy for beginner investors to get confused about bid prices and ask prices (or offer prices). If that’s the case for you, try to remember the following: Bid is buy, ask is sell And, this is from the counterparty’s (e.g., dealer) perspective. So, if you would like to trade, say, a stock, the bid…
Market order vs limit order? Let’s dive in! Imagine that you are in need of cash, and, for that reason, you need to sell some shares of a stock you own. What type of trade order should you submit to meet your liquidity needs? If your need for cash is urgent, what you need is…
An easy way to visualize the distribution of stock returns is to plot a histogram. In this tutorial, we will teach you how to create a histogram using Excel. Moreover, we will explain how to interpret a histogram of stock returns. Jump to: Using Excel’s “data analysis” tool to plot a histogram We will be…
The purpose of this tutorial is to show you how to plot time series of stock prices and returns using Excel. And, we will also explain how to interpret these plots to gain a better understanding of stock prices and returns. We will use Microsoft Corporation (MSFT) shares and Kellogg Company (K) shares as examples.…
In this tutorial, we will explain how to download stock price data from Yahoo! Finance. Yahoo! Finance is a great source for obtaining historical data on financial securities such as stocks, stock market indices (e.g., S&P 500, Dow Jones Industrial Average, FTSE 100), and ETFs. It has global coverage, and the data is free to download.…
Step-by-step tutorials:
Downloading stock price data
Plotting stock prices and returns
Creating a histogram of stock returns
Descriptive statistics for stock returns
Computing the correlation between two stocks
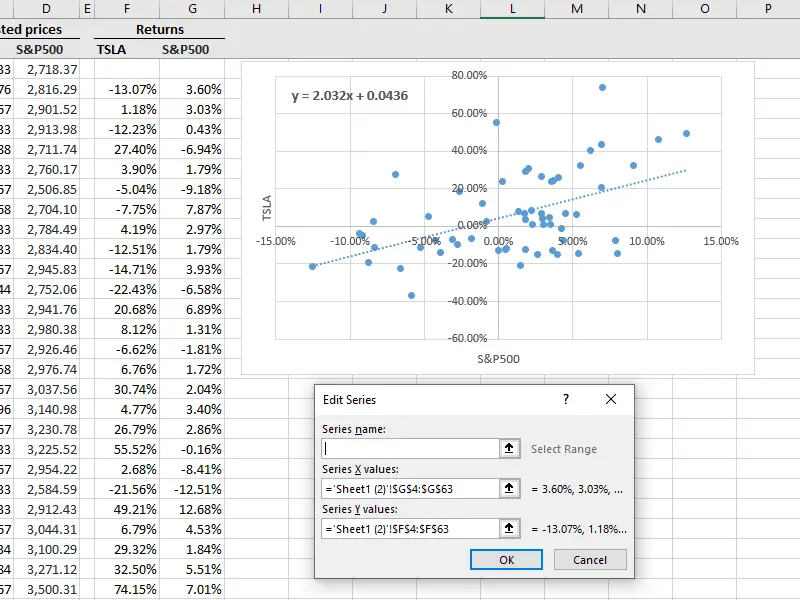
Calculating a stock’s beta
Modern portfolio theory:
Portfolio return
Portfolio risk
Efficient frontier
Optimal risky portfolio
Market equilibrium:
Capital asset pricing model (CAPM)
Arbitrage pricing theory (APT)